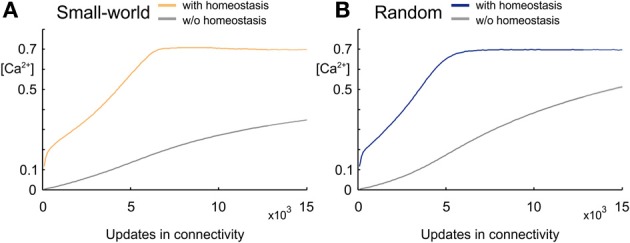
Figure 2.

Development of intracellular calcium concentration [Ca2+] over time. (A) Development of calcium concentration in small-world networks arising from synapse formation that favors short-range over long-range connections. Mean calcium concentrations averaged over five simulations reach the set-point ϵ = 0.7 when the number of synaptic elements is regulated homeostatically (yellow), whereas calcium concentrations remain much lower when there is no homeostatic regulation (gray). (B) Development of calcium concentration in random networks without any distance-dependency in synapse formation. The random network with homeostatic regulation of synaptic elements (blue) also reaches the homeostatic set-point ϵ, whereas the network without homeostasis (gray) and the same number of synapses as the homeostatic network has much lower values in calcium. Shadow around the curves (hardly visible since so small) indicates the standard deviation.
