
Figure 7.
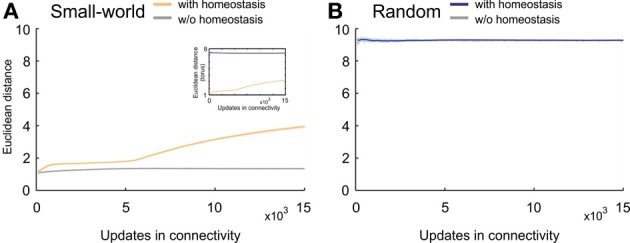
Average Euclidean distance between pre- and postsynaptic neurons for every synapse during network development. (A) Small-world networks with (orange) and without (gray) homeostasis in electrical activity. (B) Random networks with (blue) and without (gray) homeostasis in electrical activity. Means over five simulations per scenario. Shadings of the curves indicate standard deviations. Inset in (A) depicts the change in Euclidean distances for homeostatic random (blue) and homeostatic small-world networks (orange) with torus boundary conditions.