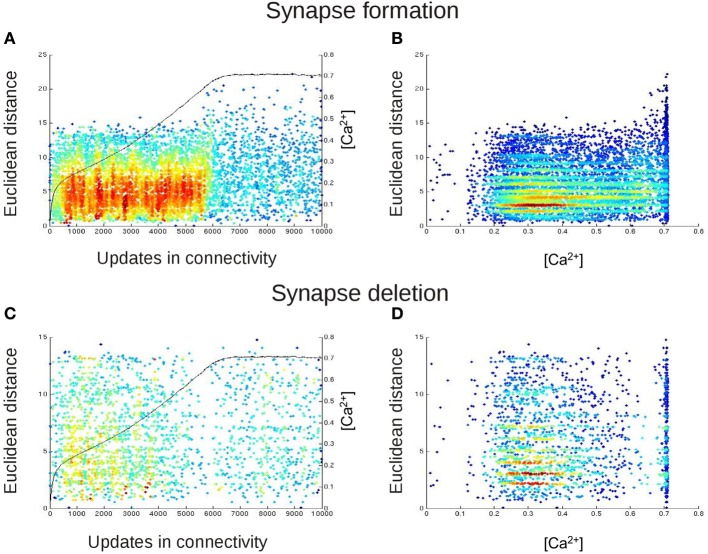
Figure 9.
The spatial distribution of newly formed synapses change in dependence on the calcium concentration. In (A,B), each dot represents the Euclidean distances between those neurons that are most likely to form a synaptic connection with each other at this update in connectivity. For this, we took at every update in connectivity in which vacant synaptic elements were available the Euclidean distance of the connection from neuron j to i for which Pformi,j (Equation 7) was maximal. In (C,D), each dot represents the length of that connection (again in terms of the Euclidean distance between the connected neurons) for which synapse deletion was most likely, i.e., Pdeli,j (Equation 6) was maximal for every update in connectivity in which synapses had to be deleted. In (A,C), we plotted the Euclidean distances for synapse formation and deletion over time. The black curve (right y-axis) indicates the course of the calcium concentration [Ca2+]. In (B,D), we plotted synapse formation and deletion in dependence on [Ca2+]. The color code in all panels indicates the density of the dots in the diagrams, with blue and red representing low and high densities of dots, respectively. The figure essentially shows that before calcium reaches the homeostatic set-point ϵ, the distribution for synapse formation is rather Gaussian, following the Kernel function K (Equation 5). The distribution becomes random and scattered, with increased Euclidean distances, when calcium is at the set-point. The stripes in the distribution arise from the fact that not all Euclidean distances are possible due to the grid layout of the network. There is no change in the distribution for synapse deletion.

