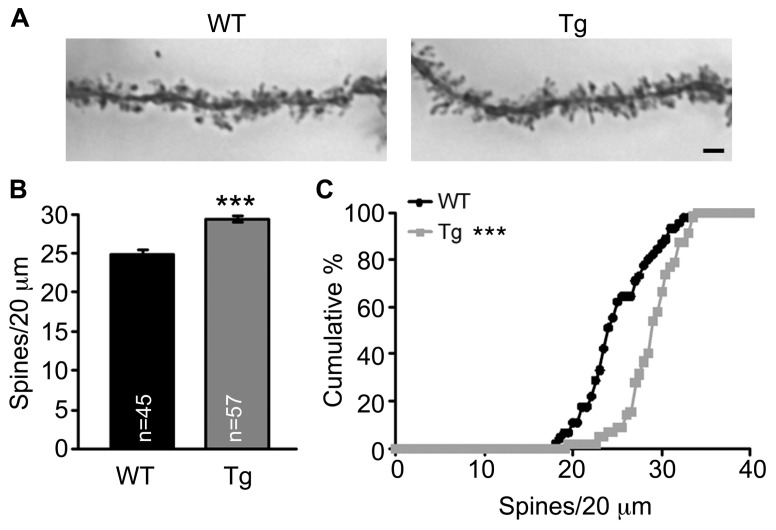
FIGURE 2.
Sarm1 knockdown increases dendrite spine density in the hippocampal CA1 region. (A) The representative images of CA1 neuronal Golgi stains are shown. (B) The mean ( ± SEM) and (C) cumulative probability of the numbers of dendritic spines were compared between WT and Sarm1 knockdown CA1 neurons. The scale bars are set at 5 μm. The sample sizes (n) of the dendrite number are indicated in the panels. The data were collected from 15 to 19 neurons from 4 WT to 4 Sarm1 knockdown mice, respectively. ***P < 0.001.

