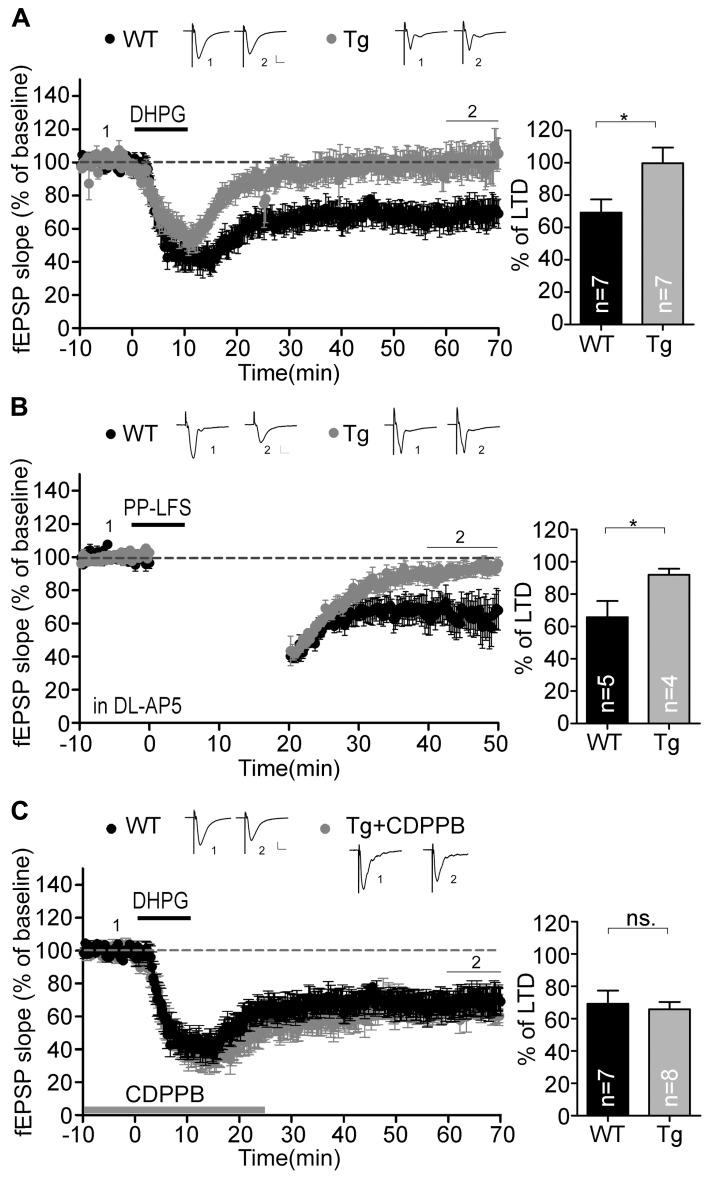
FIGURE 5.
Metabotropic GluR-dependent LTD is defective in the Sarm1 knockdown hippocampus. Chemically and electrically induced LTD were recorded in the hippocampal CA1. The fEPSP is shown plotted as a function of time, and the representative traces at the indicated time points (labeled by 1 and 2 in the figure) are shown above. mGluR-dependent LTD induced by (A) DHPG and (B) paired-pulse low frequency stimulation was impaired in Sarm1 knockdown brains. (C) CDPPB was bath applied from the baseline recording for 25 min and showed profound rescue of DHPG-induced LTD in the Sarm1 knockdown hippocampus. (A–C) The horizontal dashed lines indicate the average value of the normalized amplitude during the control period. Calibration: 0.2 mV, 10 msec. For both LTP and LTD, histograms summarizing the average of the fEPSPs of the last 10 min of recording are shown in the right panels. The data represent the mean plus SEM (for histograms) or ± SEM (for fEPSP slopes). The sample sizes (n) are indicated. *P < 0.05; ns, not significant.

