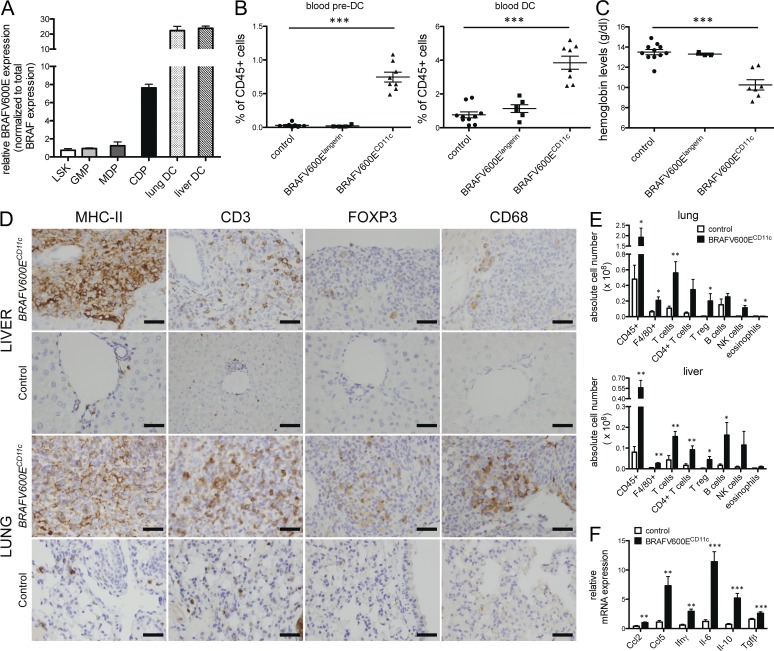
Figure 7.
Expression of BRAF-V600E in early BM-resident DC progenitors in BRAFV600ECD11c mice results in multi-systemic high-risk disease and is associated with high local cytokine expression and the recruitment of additional inflammatory cells. (A) Relative mRNA expression of BRAF-V600E in sorted BM lineage negative sca1+ c-kit+ (LSK), lin− sca1− c-kit+ CD34+ CD16/32+ granulocyte myeloid progenitors (GMPs), lin− sca1− CD135+ c-kithigh CD115+ monocyte and DC progenitors (MDPs), and lin− sca1− CD135+ c-kitlow CD115+ common DC progenitors (CDPs) and lung/liver CD45+ MHCII+ CD11c+ DCs in BRAFV600ECD11c mice as assessed by mutation-specific qPCR (data normalized to total BRAF expression, no BRAF-V600E expression detected in corresponding cells of control mice, n = 3, pooled data of three independent isolations). (B and C) Relative numbers of viable singlet CD11b+ CD115+ Flt3+ pre-DCs and CD11c+ MHCII+ DCs among circulating viable, singlet CD45+ cells (B) and hemoglobin levels (C) in BRAFV600ECD11c mice, BRAFV600Elangerin mice, and control mice (n = 4–10 per group, pooled data of four independent experiments, each data point represents one mouse). (D) Immunohistochemical analysis of liver and lung tissue sections stained with indicated mAb in BRAFV600ECD11c mice (top) and control littermates (bottom; bars, 50 µm). (E) Absolute numbers of tissue-infiltrating total hematopoietic CD45+ cells, F4/80+ macrophages, total CD3+ NK1.1− T cells, total CD3+ NK1.1− CD4+ CD8− T cells, total CD3+ NK1.1− CD4+Foxp3+ T reg cells, total CD19+ B220+ B cells, total CD3− NK1.1+ NK cells, and total SiglecF+ CD11c− eosinophils in lung and liver of BRAFV600ECD11c mice and control littermates as assessed by multicolor flow cytometry (n = 4–5 per group, representative of two independent experiments). (F) Local expression of indicated chemokines and cytokines in peripheral liver tissue was assessed by qPCR (data normalized to Gapdh expression, n = 4–5 per group). All data are shown as mean ± SEM. *, P < 0.05; **, P < 0.01; ***, P < 0.001.

