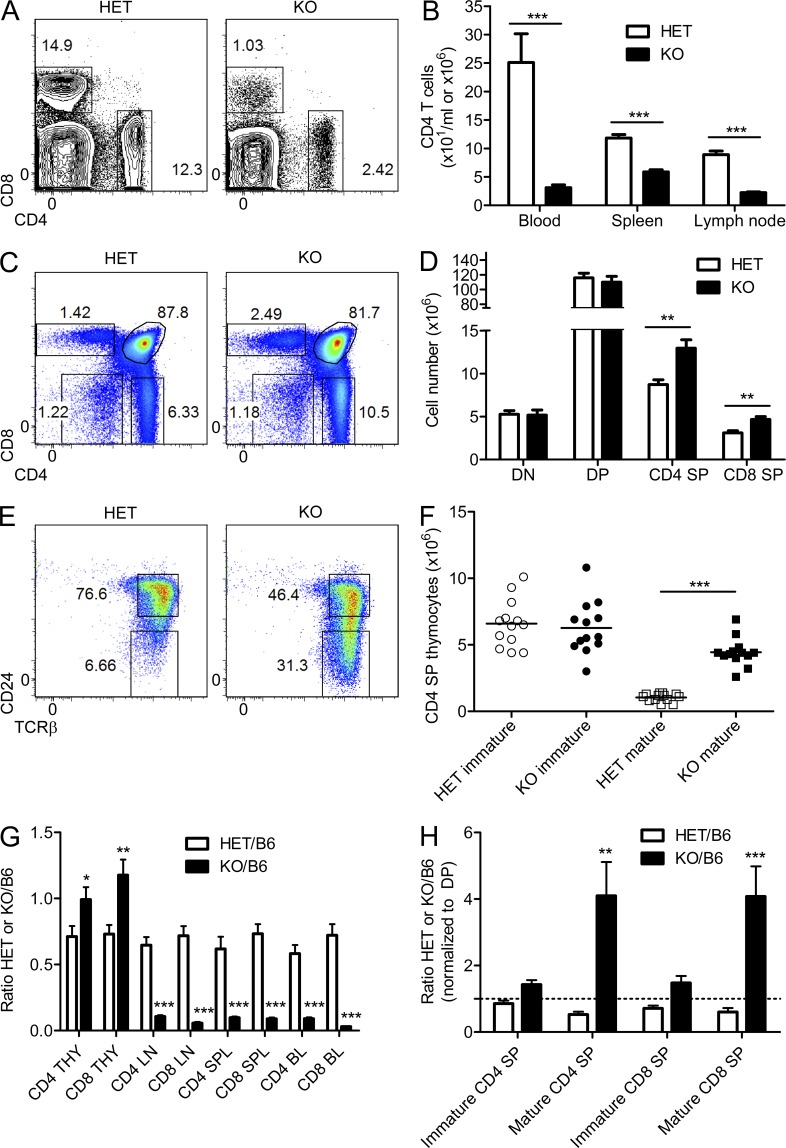
Figure 1.
T cell–specific dynamin 2 deficiency leads to lymphopenia and accumulation of mature thymocytes. (A and B) Flow cytometric analysis of blood CD4 and CD8 T cells (A) and numbers of CD4 T cells (B) in blood, spleen, and lymph node from Dnm2 HET and KO mice (n = 10). (C and D) Flow cytometric analysis (C) and numbers (D) of double-negative (DN), DP, and CD4 and CD8 SP thymocytes from Dnm2 HET and KO mice (n = 13). (E and F) Flow cytometric analysis (E) and numbers (F) of immature (TCRβhiCD24hi) and mature (TCRβhiCD24lo) CD4 SP thymocytes from Dnm2 HET and KO mice (n = 13). Horizontal bars indicate the mean. (G) Bone marrow cells from Dnm2 HET or KO mice (CD45.2+) were mixed 1:1 with WT B6 cells (CD45.1+) and injected into irradiated Rag1 KO recipients (CD45.1+) to generate bone marrow chimeras. Ratio of CD4 and CD8 T cells in thymus (THY), lymph nodes (LN), spleen (SPL), and blood (BL) from Dnm2 HET/B6 and Dnm2 KO/B6 mixed chimeras (n = 16–17) is shown. (H) Mixed bone marrow chimeras were generated as in G. Ratio of immature and mature CD4 and CD8 SP thymocytes from Dnm2 HET/B6 and Dnm2 KO/B6 mixed chimeras (n = 11–16) is shown. Ratios were normalized to the ratio of DP thymocytes to account for variable chimerism among mice. The dashed line indicates a control cell/KO cell ratio of 1. All error bars represent SEM. *, P < 0.05; **, P < 0.01; ***, P < 0.001 by unpaired Student’s t test (B, D, F, and G) or one-way ANOVA, Tukey’s post-test (H). Results are representative of or combined from three (D and F), four (G and H), or more than five (A–C and E) experiments.

