Figure 3.
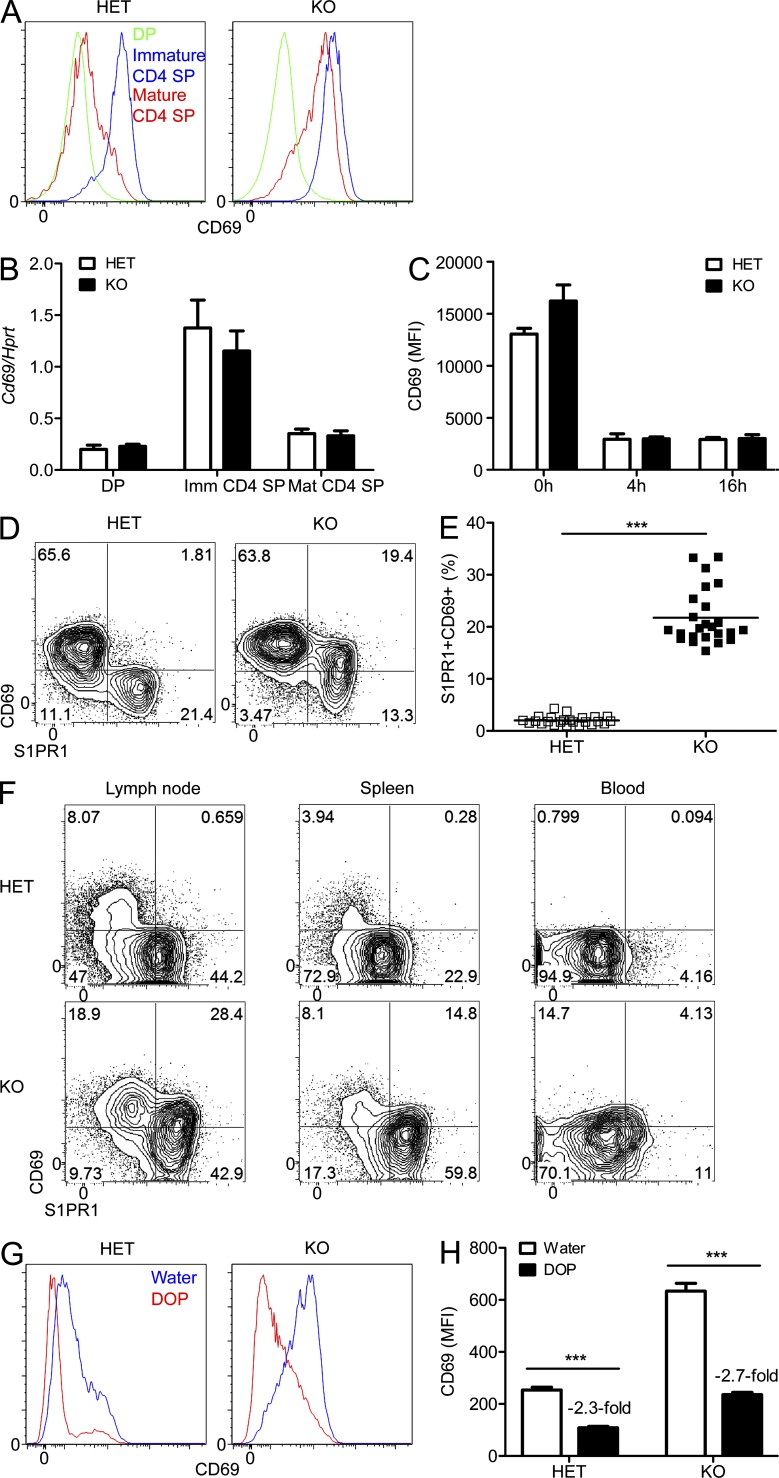
Dynamin 2 regulates S1PR1 signaling in vivo. (A) CD69 surface expression on thymocytes from Dnm2 HET and KO mice (n > 10) was measured by flow cytometry. (B) Quantitative RT-PCR analysis of CD69 mRNA expression in thymocyte populations from Dnm2 HET and KO mice (n = 4). mRNA expression was normalized to Hprt. (C) Flow cytometric analysis of CD69 surface expression on immature CD4 SP thymocytes treated with α-CD69 Ab in vitro (n = 6). MFI, mean fluorescence intensity. (D and E) Flow cytometric analysis (D) and frequencies (E) of S1PR1-CD69 coexpressing CD4 SP thymocytes from Dnm2 HET and KO mice (n = 24). Horizontal bars indicate the mean. (F) Flow cytometric analysis of S1PR1 and CD69 surface expression on naive (CD44lo) CD4 T cells from Dnm2 HET and KO mice (n = 9). (G and H) Dnm2 HET and KO mice received 30 mg/liter DOP in the drinking water or water alone. 3 d later, CD69 surface expression on mature CD4 SP thymocytes (n = 7) was measured by flow cytometry. All error bars represent SEM. ***, P < 0.001 by unpaired Student’s t test. Results are representative of or combined from two (C, G, and H), three (F), four (B), or more than five (A, D, and E) experiments.

