FIGURE 3.
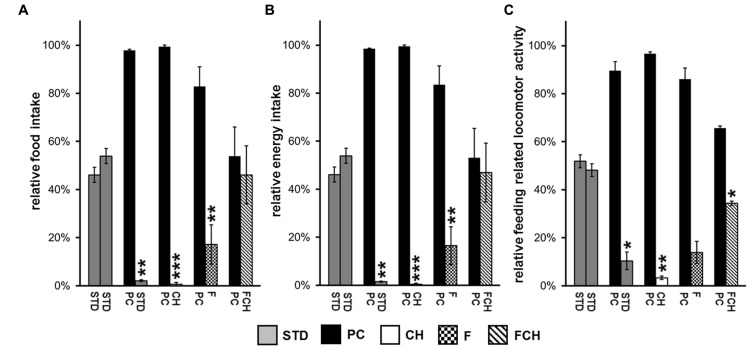
Two-choice preference tests between the different test foods: (A) Relative food intake, (B) relative energy intake, and (C) relative feeding-related locomotor activity testing standard chow (STD) in both food containers or potato chips (PC) vs. STD as well as their major macronutrients carbohydrates (CH), fat (F), and fat and carbohydrates (FCH). Mean ± standard deviation of the relative food/energy intake or locomotor activity of the independent animal groups (cages) are shown. ***p < 0.001, **p < 0.01, *p < 0.05.

