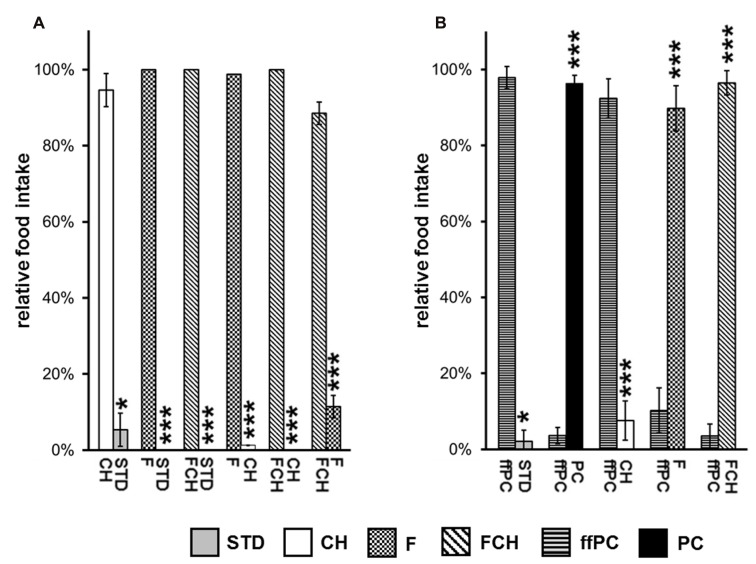
FIGURE 4.
Relative food intake during two-choice preference tests (A) applying the major macronutrients of potato chips (PC), carbohydrates (CH), fat (F) as well as fat and carbohydrates (FCH), and standard chow (STD). (B) Two-choice preference test of fat-free potato chips (ffPC) vs. STD, PC, and the macronutrients (CH, F, FCH) of PC. Mean ± standard deviation of the relative food intake of the independent animal groups (cages) is shown. ***p < 0.001, *p < 0.05.

