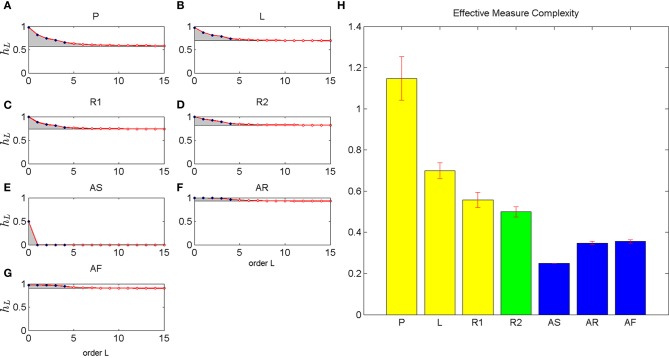
Figure 5.
Estimated conditional entropy and effective measure complexity. The left six panels (A–G) shows the estimated conditional entropy for different movement types. Up to order 4 the conditional entropy is estimated from empirical frequencies (blue dots). The asymptote (black line) is estimated from LZ complexity. The red dots show a parametric interpolation of conditional entropies according to Equation 9. The gray areas indicate the integrated excess entropies that yield the effective measure complexity shown in the right panel (H). The different movement types included self-generated patterns (P), letter drawings (L), self-paced random motion (R1), random motion during pursuit (R2), and artificial rhythmic (AS) and random motions (AR with uniform distribution and AF with empirical first order frequency).

