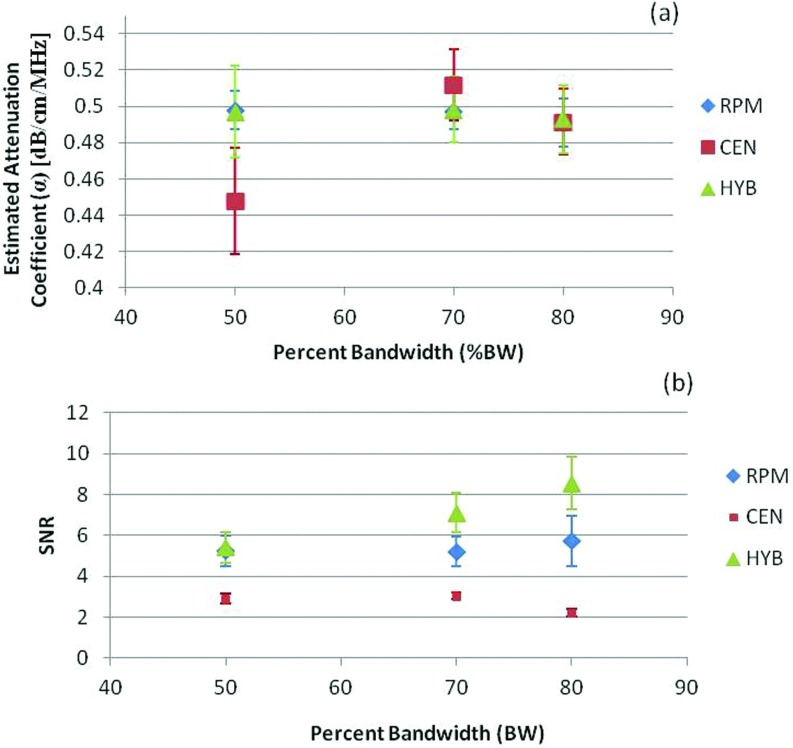
Figure 2.
The estimated attenuation coefficient and corresponding SNR obtained for different percent bandwidths using numerical simulations. The mean and standard deviation of the attenuation coefficient estimated at bandwidths of 50%, 70%, and 80% are shown in (a), while the SNR variations are plotted in (b).

