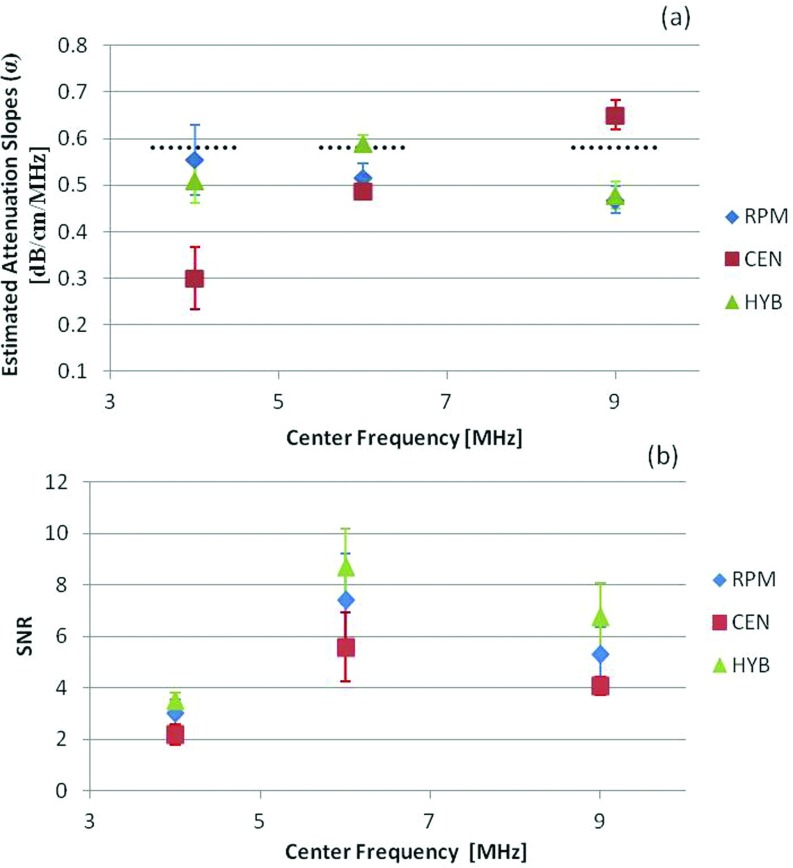
Figure 7.
The estimated attenuation coefficient and corresponding SNR obtained using experimental TM phantoms. The mean and standard deviation of the attenuation coefficient estimated at center frequencies of 4, 6, and 9 MHz using the VFX 9L4 transducer are shown in (a), while the SNR variations are plotted in (b). The dotted black line indicates the measured attenuation coefficient of the sample phantom obtained using a narrowband substitution measurement method.

