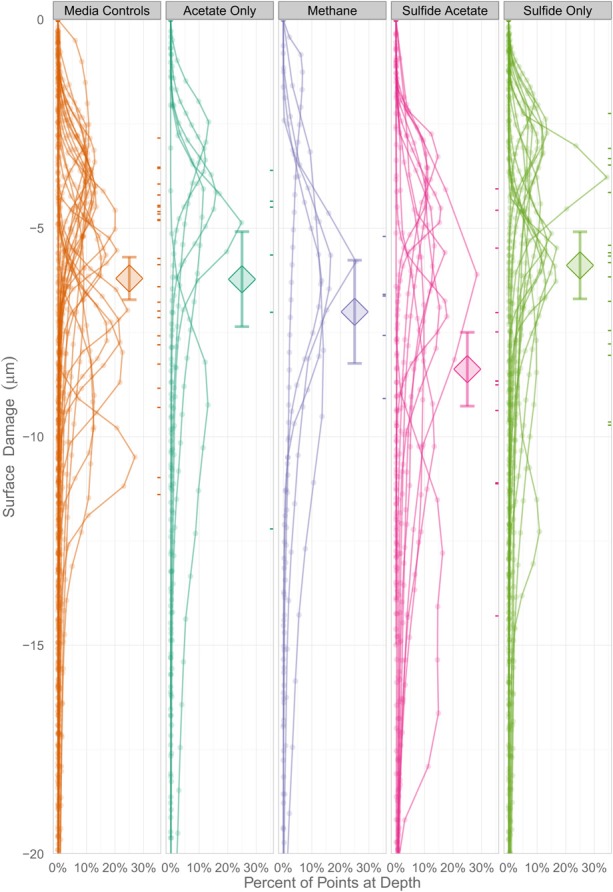
Figure 7.

A Bayesian multilevel model comparing the mean surface damage for treatment groups as well as individual coupons. The diamonds indicate a treatment group's mean depth, and the tick marks on the right side of the columns indicate an individual coupon's mean depth. The error bars mark the 16 and 84% percentiles of each treatment's posterior distribution, which corresponds to the asymptotic 68% coverage of a ±1 standard error band, but is allowed to be asymmetric.
