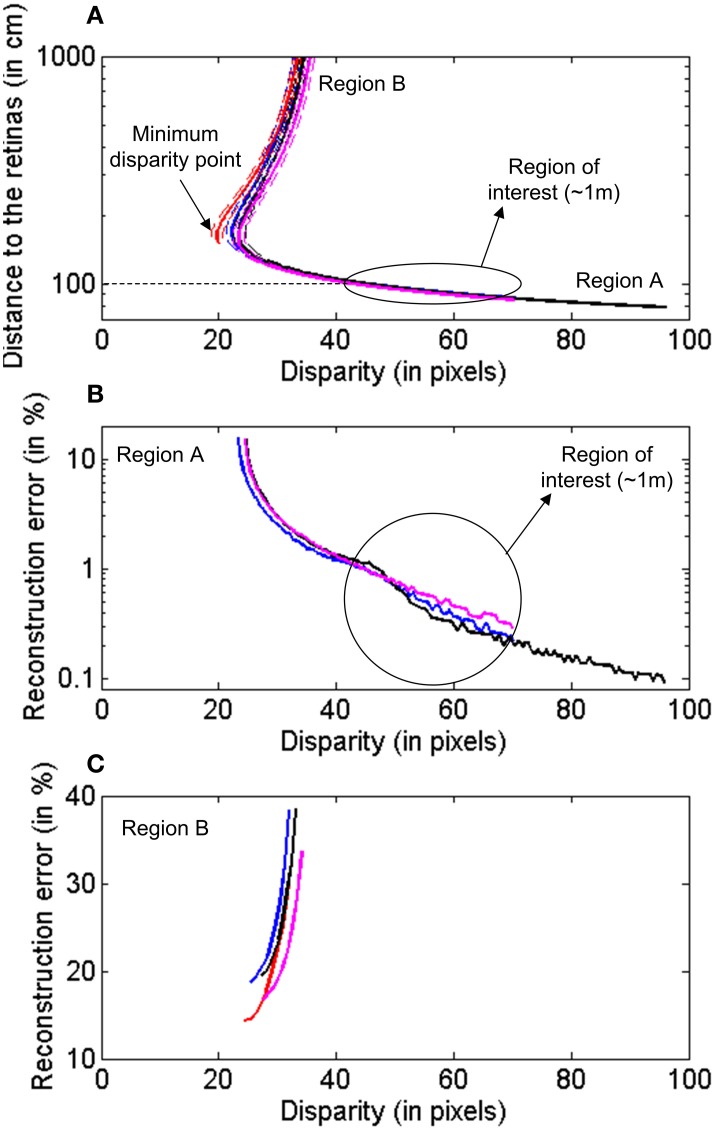
Figure 10.
Characterization of the 3D reconstruction of the epipolar lines for different pixels in Retina 1. Each color represents a different pixel. (A) Distance between the reconstructed points and the retinas for different disparity values. The dashed lines represent the upper and lower limits associated to the allowed deviation around the epipolar line. (B) Reconstruction error for 3D points closer to the retinas, Region A. (C) Reconstruction error for points farther from the retinas, Region B.

