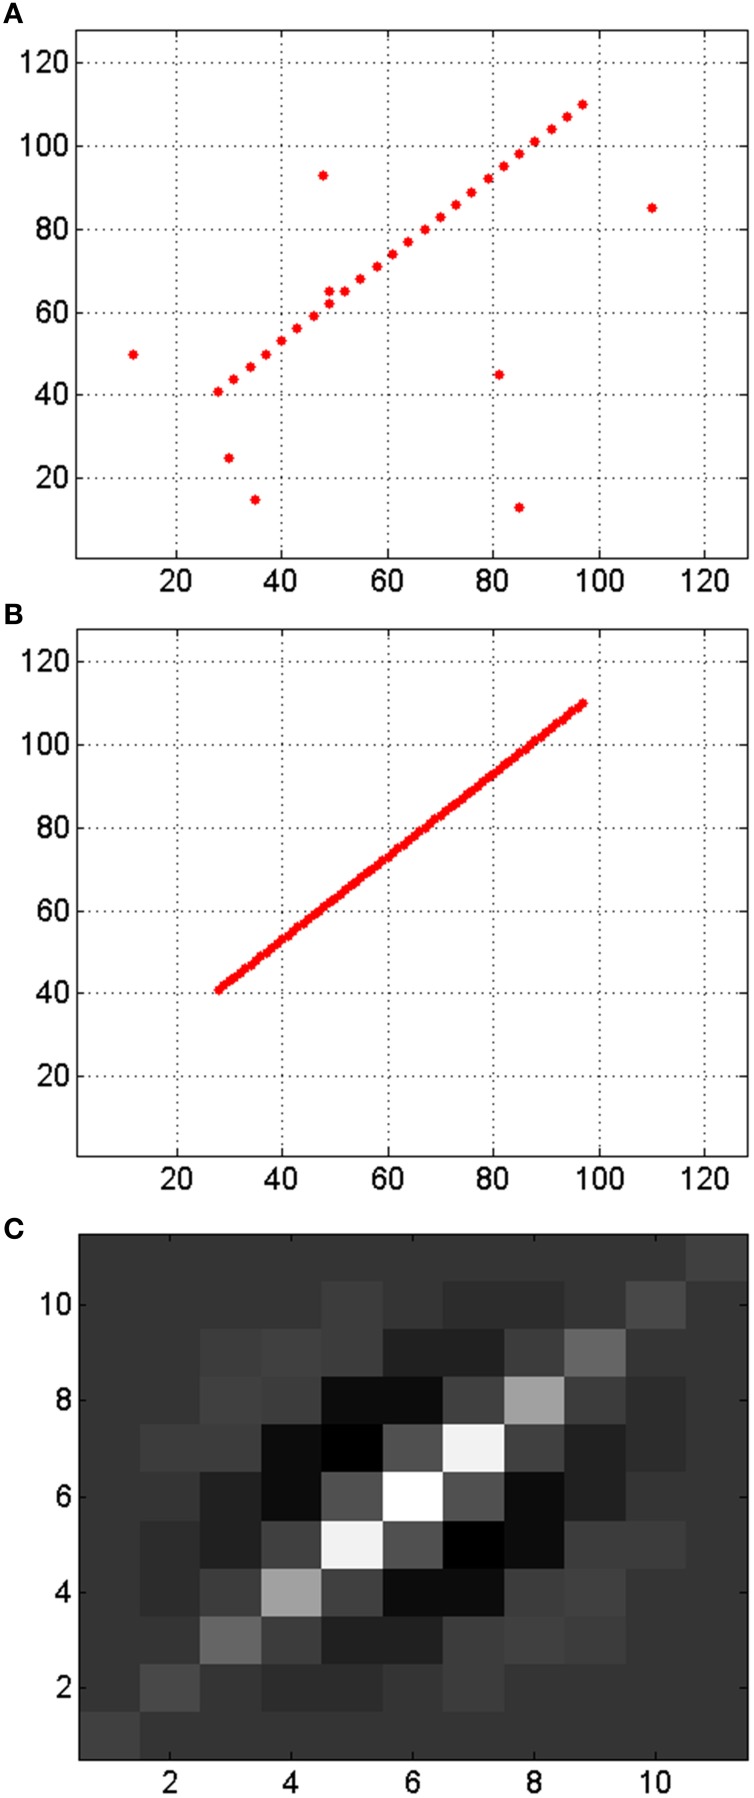
Figure 13.
Illustration of enhancing edges and noise reduction by a Gabor filter. (A) Input events representing a discontinuous edge with noise. (B) Output events generated by the Gabor filter, with the reconstructed edge without noise. (C) Gabor kernel. All axes represent pixels, being the visual space in (A,B) 128 × 128 and the size of the kernel in (C) 11 × 11.

