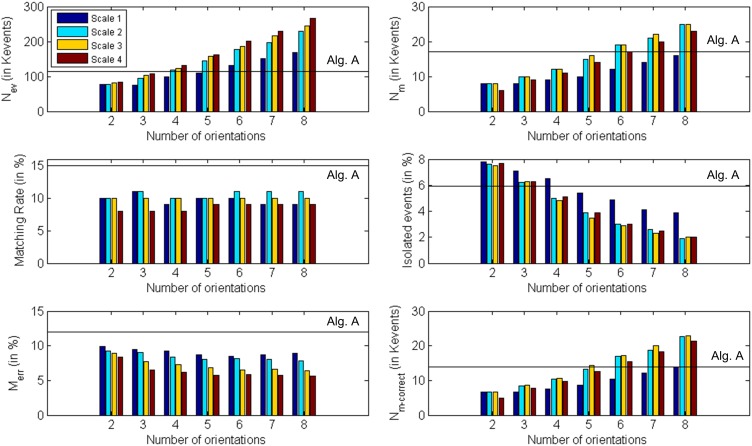
Figure 18.
Graphical representation of Table 2. Each subplot corresponds to a different row of the table, showing the obtained values for each number of orientations and scale. The black horizontal lines indicate the values obtained using algorithm A (0 orientations).

