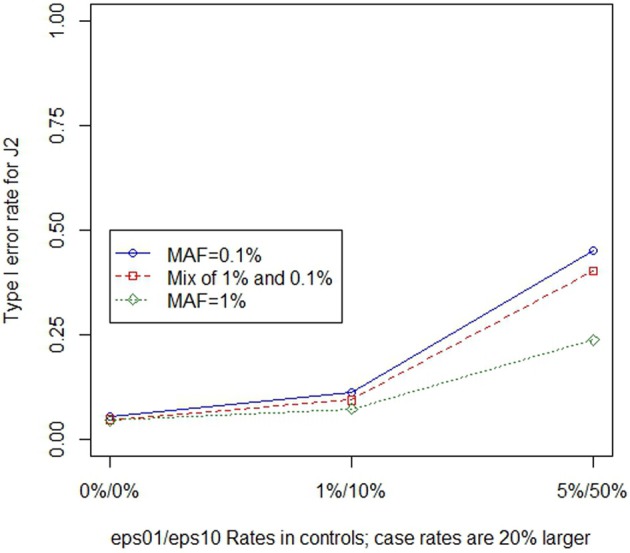
Figure 2.

Type 1 error rate for J2 in the presence of differential genotype errors at different MAF. As differential error rates increase, the type I error rate increases. The type I error rate is illustrated at a site with eight non-causal variants. As differential (20% higher in cases) genotype error rates increased, the type I error rate increased. When the MAF was low, this effect was even larger.
