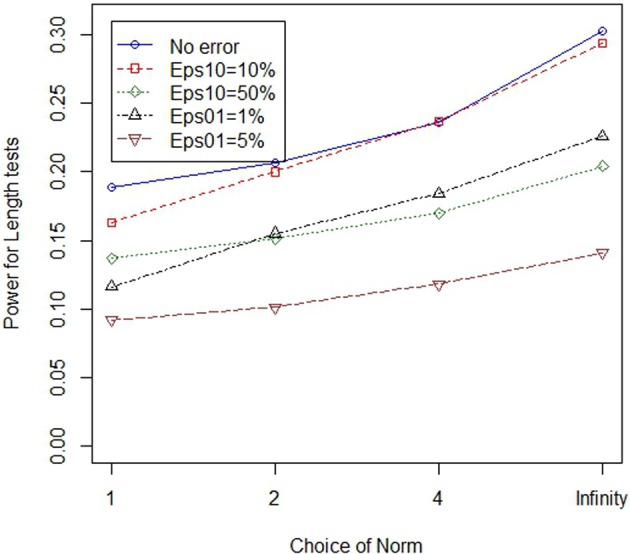
Figure 3.

Higher norms are more robust to genotype errors when the proportion of non-causal variants is larger: length tests. The figure illustrates power of four different (norm) length statistics, under varying error models. All test statistics experience power loss in the presence of errors. However, power loss can be mitigated through the use of high norm test statistics.
