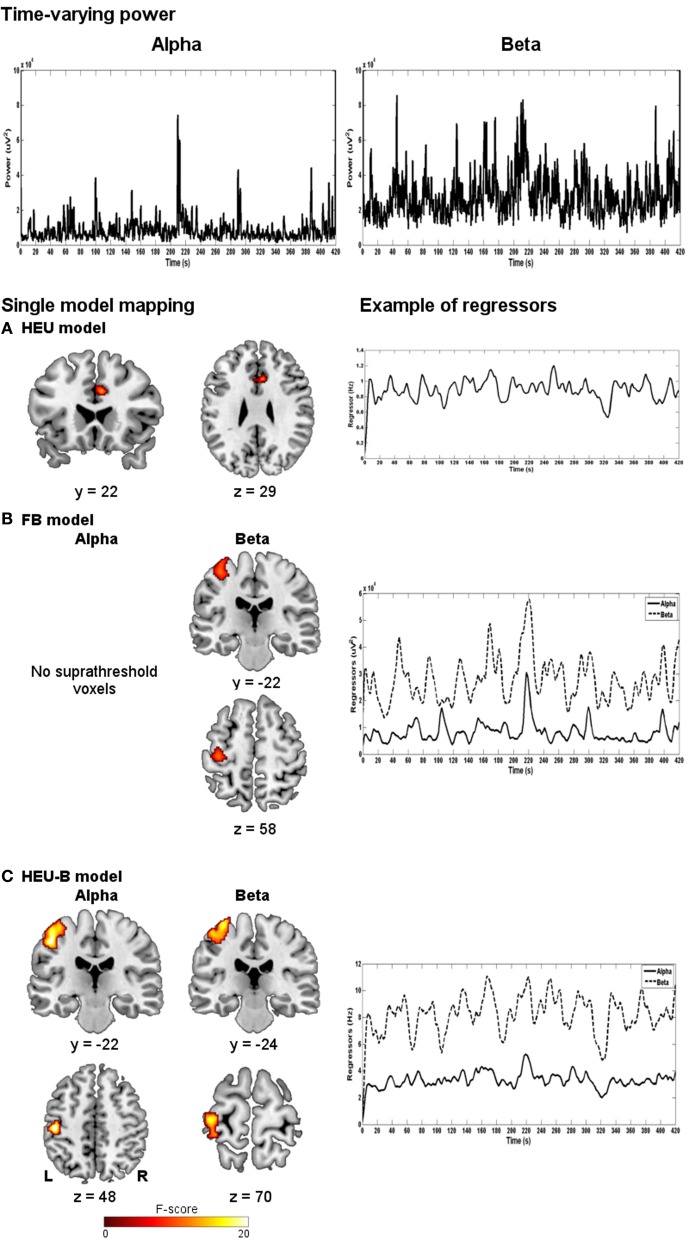
Figure 3.
Single-model mapping. Top panel: alpha and beta time-varying EEG power for a representative subject. Bottom panel: group maps obtained using HEU (A), FB (B) and HEU-B (C) models, along with examples of regressors for a representative subject (after downsampling and convolution with HRF). For FB and HEU-B models, neural correlates for alpha and beta rhythms are shown (HEU: p < 0.001, uncorrected; FB: p < 0.001, uncorrected; HEU-B: p < 0.05, FDR).

