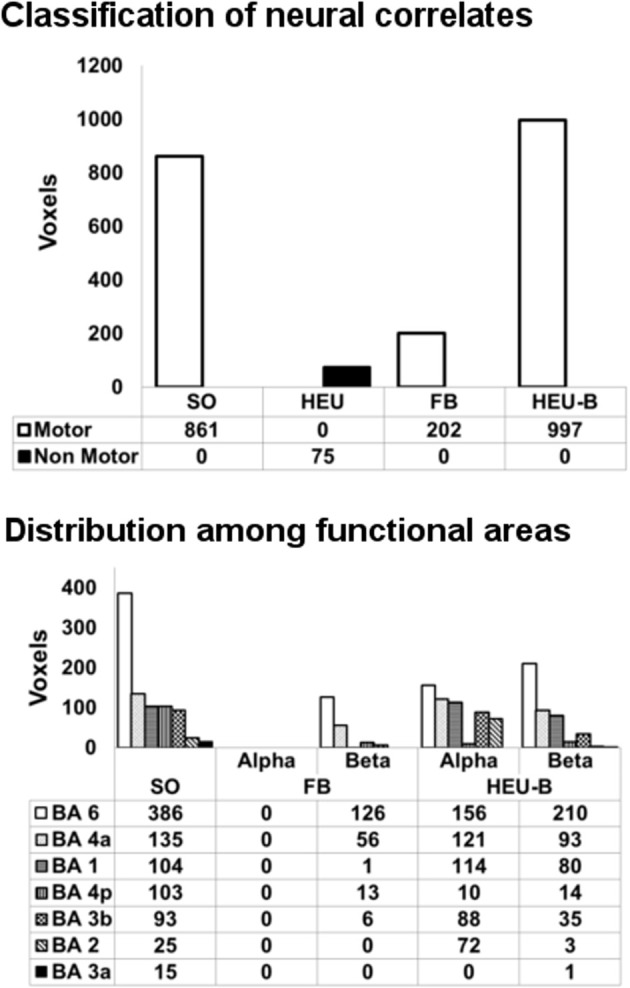
Figure 4.

Classification of neural correlates from single model mapping. Top panel: voxels classification according to the BAM (voxels belonging to the same areas activated in SO analysis are classified as “motor” voxels). Bottom panel: distribution of “motor” voxels among the Brodmann areas identified by the SO analysis. Since HEU model only produced “non motor” voxels, it was not included in this second classification. The number of voxels assigned to the classes are tabulated below bars.
