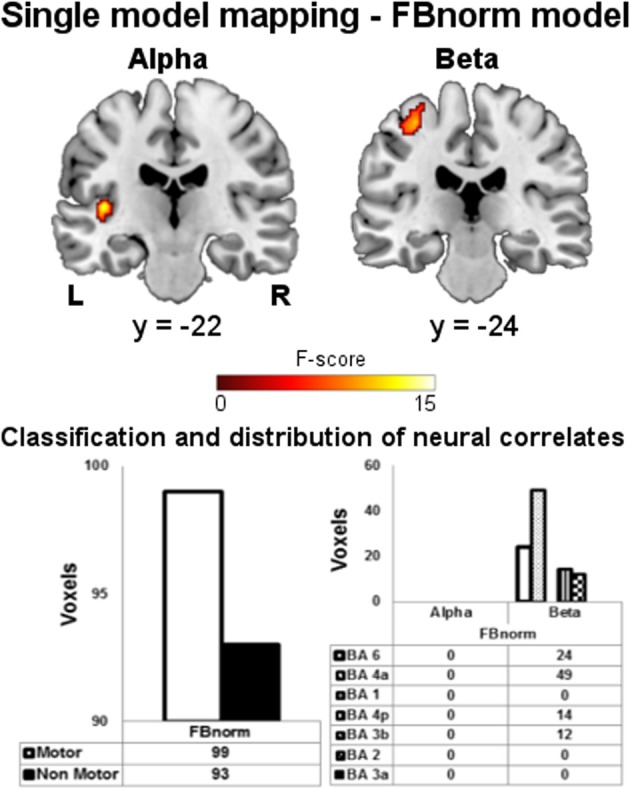
Figure 5.

Single model mapping—FBnorm model. Top panel: group maps obtained from single model mapping using FBnorm model. Neural correlates for alpha and beta rhythms are shown (p < 0.001, uncorrected). Bottom panel: (left) voxels classification according to the BAM; (right) distribution of “motor” voxels among the Brodmann areas identified by the SO analysis. The number of voxels assigned to the classes are tabulated below bars.
