
Figure 7.
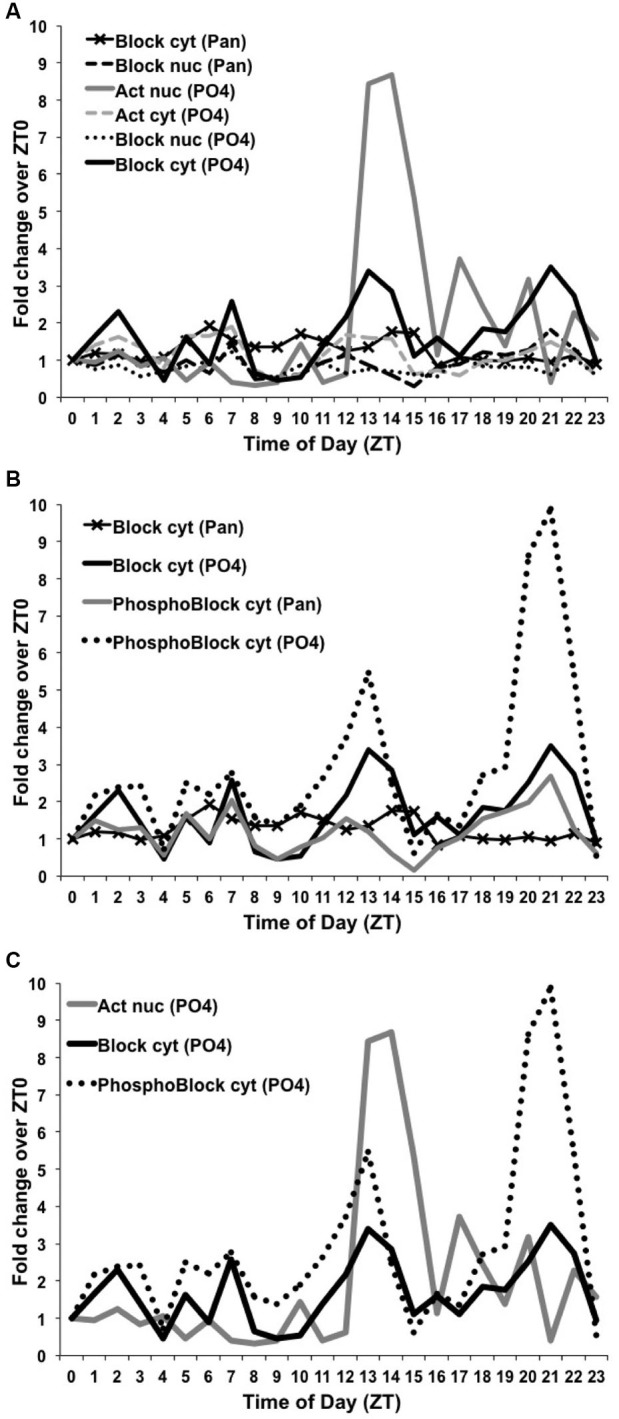
Levels of dCREB2 protein isoforms oscillate through the day/night. Quantification of Western blot images from samples generated by wild-type flies collected each hour across a day (see Figures 5 and 6). Each dCREB2 band was normalized to the appropriate loading control across time points. Data are presented as fold changes of the normalized values for each isoform compared to the normalized ZT0 value for that isoform. p35 Activator, p40 Blocker, and hyperphosphorylated p40+ Blocker dCREB2 species (labeled “Act”, “Block”, and “PhosphoBlock”, respectively) are presented for both nuclear (nuc) and cytoplasmic (cyt) samples. (A) Illustrates the nuclear increase in Activator during the early night (solid gray line) and fluctuating levels of cytoplasmic Blocker, which show multiple peaks and troughs (solid black line). (B) Highlights the strong early- and late-night peaks in cytoplasmic, hyperphosphorylated Blocker species (dotted black line). (C) Three dCREB2 species have time points with greater than 2-fold increases over ZT0 values.