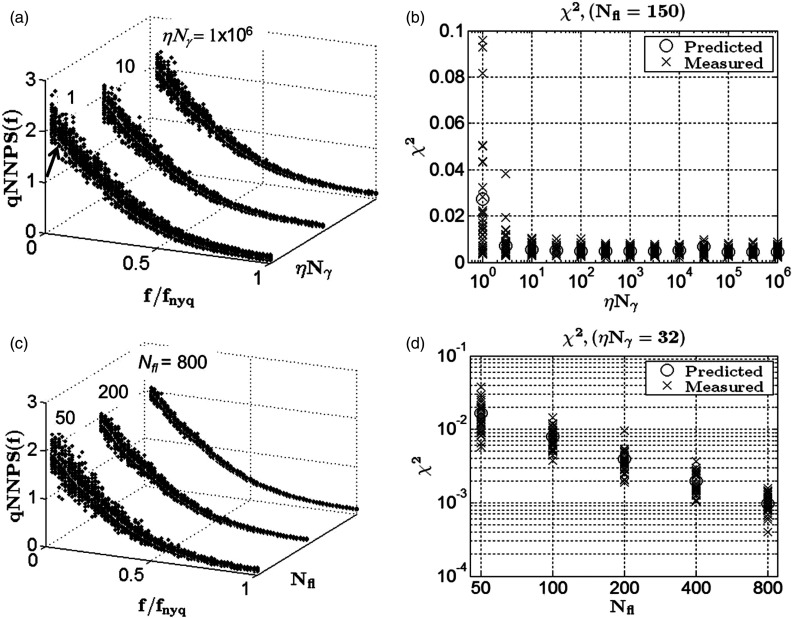
Figure 5.
Simulation results using the layered model described in Table 2. (a) Stacked plot of for three different signal intensities, ηNγ. Each plot shows the superimposed qNNPS estimates from 20 simulations started with different random seeds. A bias is seen for ηNγ = 1 (arrow) while the distributions of the plots for ηNγ = 10 and ηNγ = 106 are nearly identical and show no bias. (b) Distribution of χ2 vs ηNγ. The circles show expected values from Eq. 20 while the x's show a measured value for each experiment. (c) distribution as a function of the number of flood fields, Nfl, with ηNγ set to 32. (d) Measured (x) and predicted (o) χ2 distributions. Combined, these plots show there is no further value to increasing the number of launched photons per flood image beyond that required to eliminate the bias in the estimate. However, there is significant value to increasing the total number of flood images to reduce noise.

