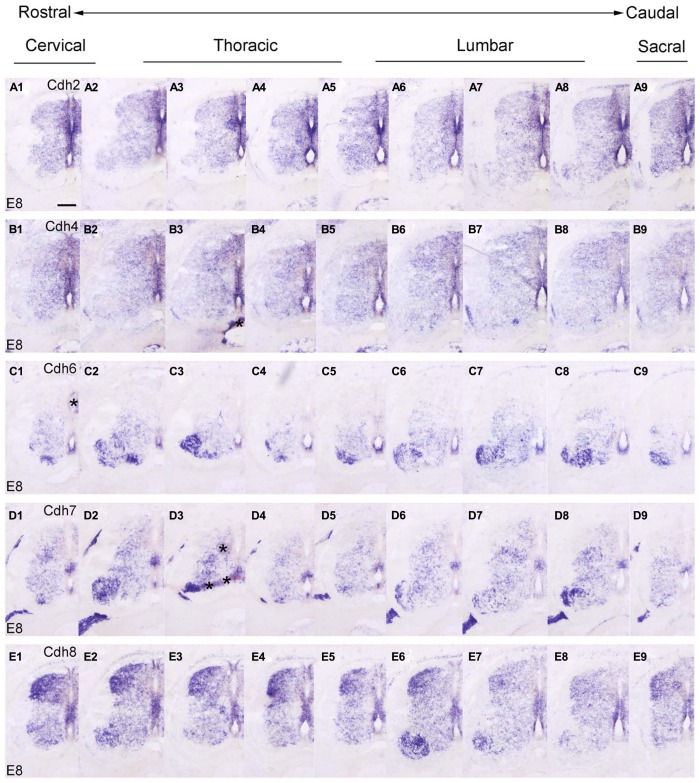
FIGURE 7.
Rostrocaudal expression profiles of Cdh2 (A1–9), Cdh4 (B1–9), Cdh6 (C1–9), Cdh7 (D1–9), and Cdh8 (E1–9) in transverse adjacent sections of the spinal cord at 8 days’ incubation (E8) visualized by in situ hybridization. The asterisks in B3,C1,D3 indicate artificial folds in the tissue. Scale bar: 200 μm in A1 (for all panels).

