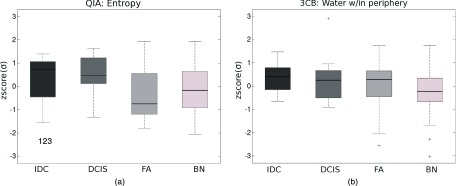
Figure 2.

Boxplots of (a) a QIA feature and (b) a 3CB feature [standardized (“zscore”) to zero mean and unit standard deviation σ] selected in stepwise feature selection in the task of distinguishing between malignant and benign lesions. A horizontal line in each box indicates the median value, the box boundaries denote the 25th and 75th percentiles, the whiskers indicate the range excluding outliers, and “+”s mark individual outliers.
