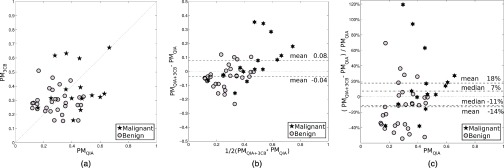
Figure 3.

The computer-estimated probability of malignancy in leave-one-case-out cross-validation (a) obtained by “3CB alone” vs “QIA alone” analyses, (b) in a Bland–Altman plot of “QIA+3CB” and “QIA alone” analyses, and (c) as the relative shift of “QIA+3CB” with respect to “QIA alone.”
