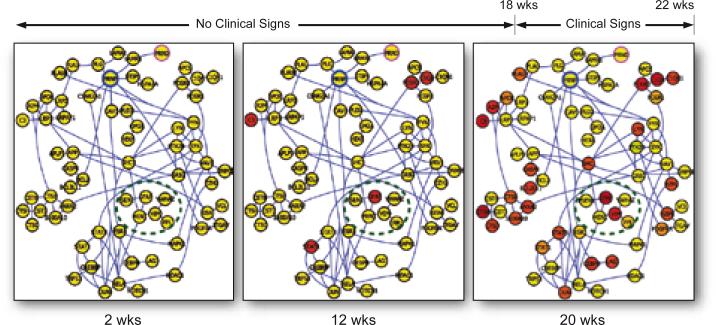
Figure 2.
A schematic of the network perturbations of one neural degenerative network over the 20 weeks of the progression of this disease in a mouse model. The red nodes indicate mRNAs that have become disease perturbed as compared with the brain transcripts of normal mice. The spreading of the disease-perturbed networks at the 3 different times points is striking--indicating the progressive disease-perturbation of this neurodegenerative network.

