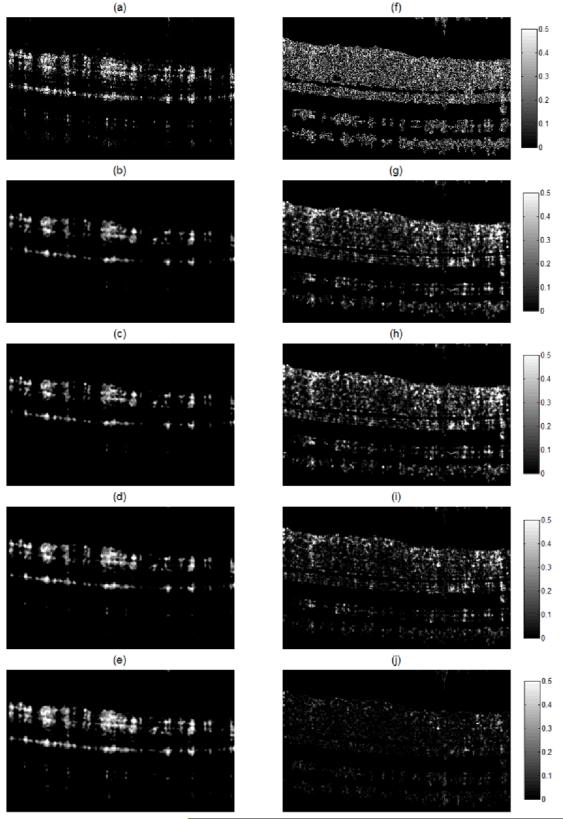
Figure 4.
Cross-sectional flow image for the NA-OMAG (a) with no filter, and with an (b) average, (c) Gaussian, (d) median and (e) weighted average filter. Squared difference between the A-OMAG B-frame (Figure 3b) and the NA-OMAG B-frame (f) with no filter, and the (g) average, (h) Gaussian, (i) median, and (j) weighted average filter. The images were captured with an SDOCT system.

