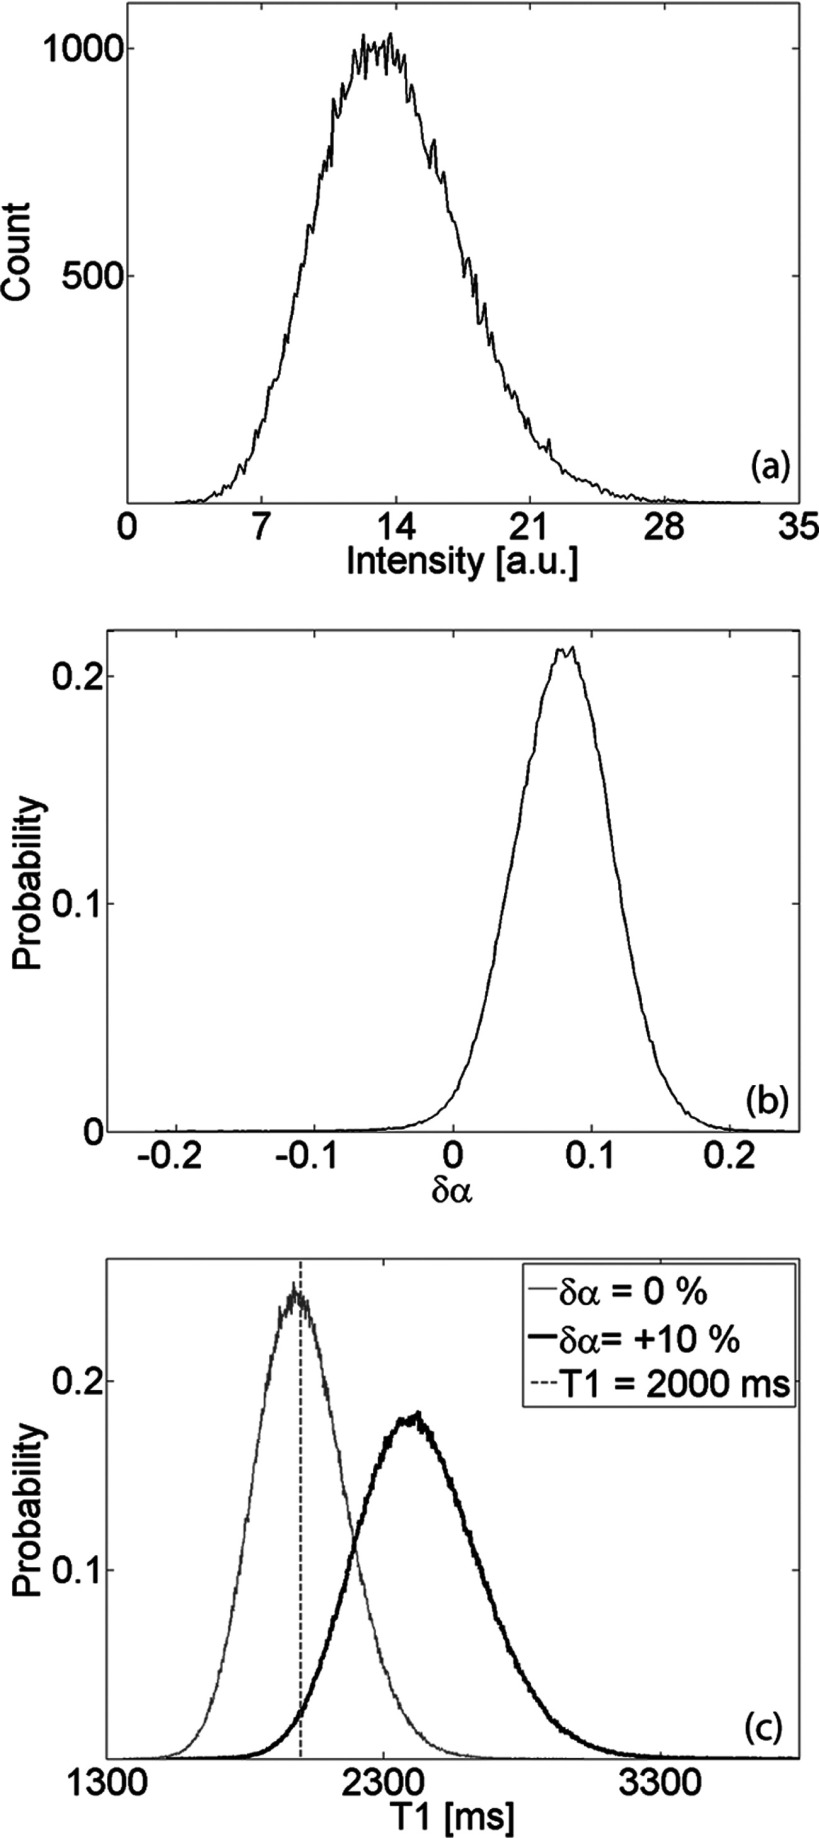
Figure 1.
(a) Representative histogram of signal intensity in artifact-free background ROI (region with no NMR signal). The noise power equals the variance of the measured distribution. (b) Distribution of excitation flip angle (referenced with respect to prescribed flip angle) measured in uniform CuSO4 phantom. (c) Estimated PDF of T10 in a single pixel with for two cases: no bias in flip angle (αSNR ≈ 30, δα = 0) and distribution given in panel (b).

