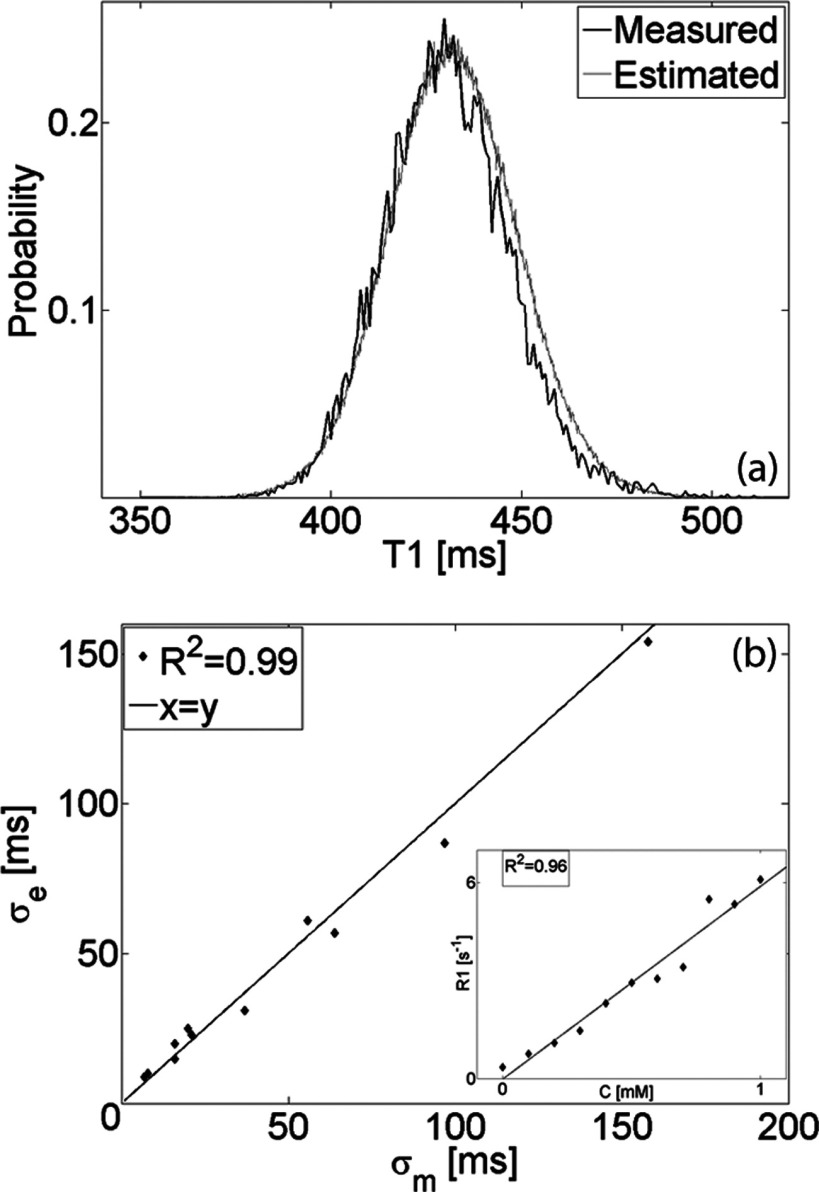
Figure 2.
(a) Comparison of T10 distribution estimated numerically with distribution measured in an ROI of ≈104 pixels in uniform phantom. (b) Estimated (σe) vs measured (σm) T10 standard deviation in phantoms with increasing CA concentration (inset shows relation between the concentration C [mM] and measured relaxation rate R1 [s−1]).

