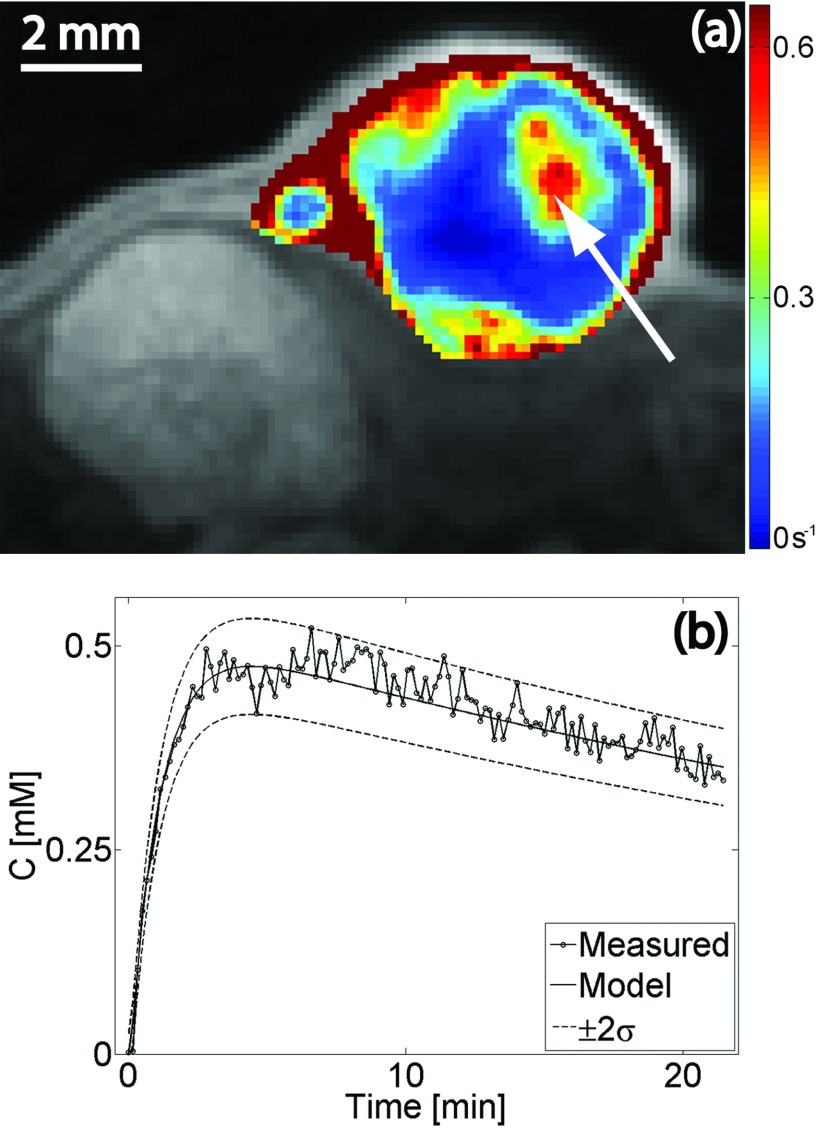
Figure 5.
(a) Overlay of Ktrans map on a contrast-enhanced T1-weighted image from a central slice in the tumor. (b) Time-varying contrast agent concentration in a single pixel [arrow in panel (a)]. The predicted curve obtained by solving Eq. 8 and the uncertainty estimated by Eq. 11 are superimposed on the measured concentration curve.

