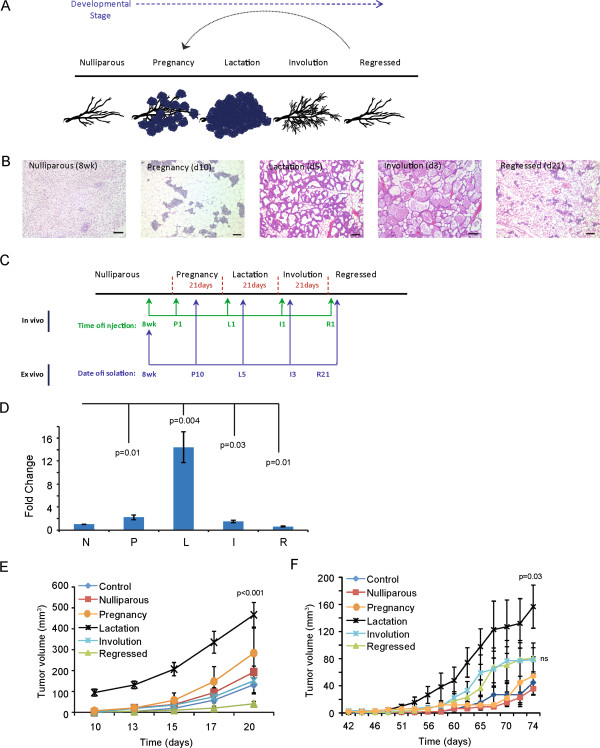
Figure 1.
Developmental stage of the mammary gland adipose tissue influences breast cancer growth. (A) Schematic of stages of postnatal mammary gland development. (B) Representative H & E-stained sections of mammary glands isolated at five stages of development. Scale bar = 100 μm. (C) Diagram depicting experimental strategy and timepoints of in vivo mammary gland injections and adipose tissue isolation. See Methods for specific details. (D) 4 T1-12B cells were injected into the fourth inguinal fat pad of Balb/c mice at each developmental timepoint (n = 10 per group). Tumor weight was normalized to the nulliparous group. (E) The tumor growth curve of mice injected at eight weeks (nulliparous) of age with 4 T1-12B cells co-mixed with mouse adipose stromal cells (n = 10 per group). P values indicate significance compared to nulliparous mice. Data are means ± SEM. (F) Tumor growth curve of mice injected at eight weeks of age with COMMA-D cells co-mixed with mouse adipose stromal cells (n = 10 per group). P value indicates significance compared to nulliparous. Data are means ± SEM. SEM, standard error of the mean.

