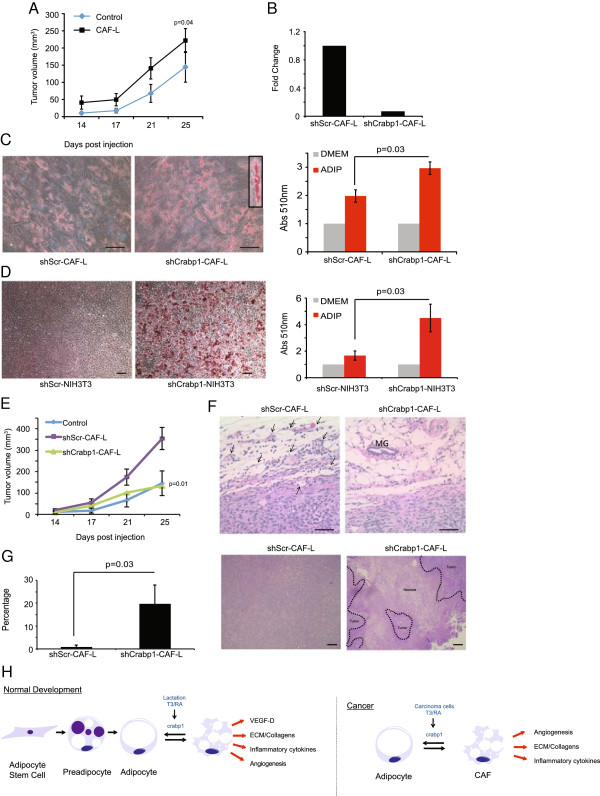
Figure 6.
Crabp1 regulates CAF phenotype. (A) Tumor growth curve of mice injected at eight weeks of age with SUM159 cells co-mixed with CAF-L cells (n = 10 per group). P value indicates significance compared to SUM159 cells alone. Data are means ± SEM. (B) Quantitative RT-PCR of crabp1 in CAF-L cells transduced with shRNA for crabp1 or scrambled control. Data are presented as average 2(-ΔΔCt ± SEM; n = 3. (C) Representative image of Oil Red O staining and quantification of CAF-L cells transduced with shRNA for crabp1 or scrambled control and exposed to adipocyte differentiation media. Data are presented as average absorbance ± SEM. Untreated cell absorbance is set to one; n = 3 experiments. Scale bar = 100 μm. (D) Representative image of Oil Red O staining and quantification of NIH3T3 cells treated with shRNA for crabp1 or scrambled control and exposed to adipocyte differentiation media. Data are presented as average absorbance ± SEM. Untreated cell absorbance is set to one; n = 3 experiments. Scale bar = 100 μm. (E) Tumor growth curve of mice injected at eight weeks of age with SUM159 cells co-mixed with CAF-L cells transduced with shRNA for crapb1 or scrambled control (n = 10 per group). P value indicates significance compared to shScr-CAF-L cells. Data are means ± SEM. (F) Representative H & E images of SUM159 tumors co-mixed with CAF-L cells. V = vessel; MG = mammary gland duct. Scale bar = 100 μm. (G) Representative images and quantification of the percentage of centralized tumor necrosis in SUM159 cells co-mixed with CAF-L cells transduced with shRNA for crapb1 or scrambled control (n = 5 per group). (H) Schematic of phenotypic modulation of adipocytes under physiologic (normal development) and pathologic (breast cancer progression) conditions. CAF-L, carcinoma-associated fibroblast-like; crabp1, cellular retinoic acid binding protein-1; SEM, standard error of the mean.

