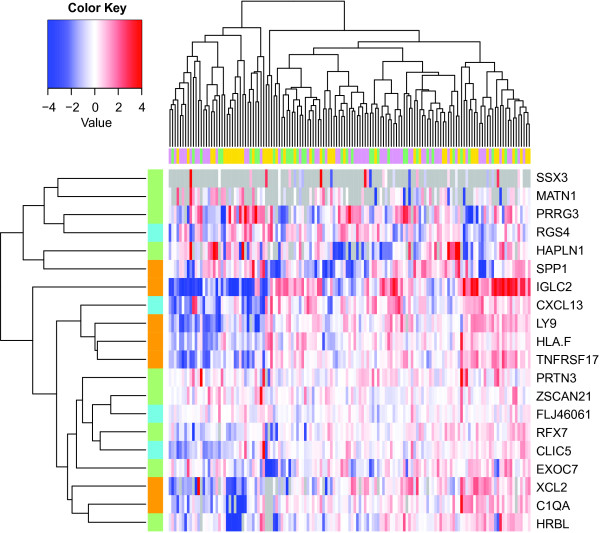
Figure 2.
Hierarchical clustering of signature gene expression in the FFPE cohort measured by RT-PCR. ΔΔCT values are median-centered within each individual sample source and clustered. Red/blue color intensity reflects magnitude of the ΔΔCT. Gray denotes missing value. Column color bar denotes sample source (plum: Mayo Clinic, gold: Guy’s Hospital, green: California Pacific Medical Center). Row color bar reflects signature membership (orange: IRS, turquoise: the four high priority Buck-14 genes, pale green: low priority Buck-14 genes not used in the index computation).

