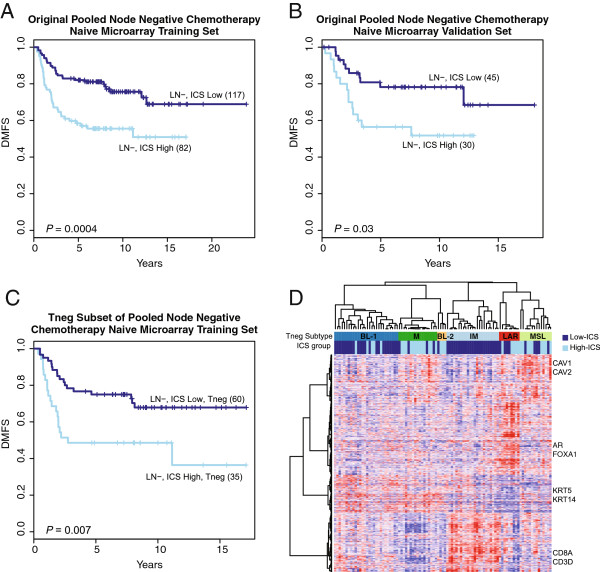
Figure 6.
Use of pooled microarray datasets to validate FFPE/RT-PCR derived and rpart determined ICS prognostic threshold. The rpart identified ICS threshold for optimal risk stratification of FFPE LN- cases (0.2578) was applied to dichotomize outcome (DMFS) in two previously reported microarray datasets representing 274 node-negative and adjuvant chemotherapy naïve HRneg/Tneg breast cancer cases [22]. Kaplan-Meier curves of ICS dichotomized groups from (A) training and (B) validation HRneg microarray datasets (dark blue = LN-, ICS Low; skyblue = LN-, ICS High) and (C) the Tneg subset (n = 95) of training cases. (D) Heatmap of Tneg subtype centroid genes within the six consensus clusters. Samples are arranged by Tneg subtypes (dark blue: BL-1, darkgreen: M, orange: BL-2, skyblue: IM, red: LAR, and pale green: MSL) with their corresponding ICS group assignment displayed below (dark blue: ICS Low, skyblue: ICS High). Color intensity of the heatmap reflects magnitude of gene expression on a red-blue scale (red: positive, blue: negative).

