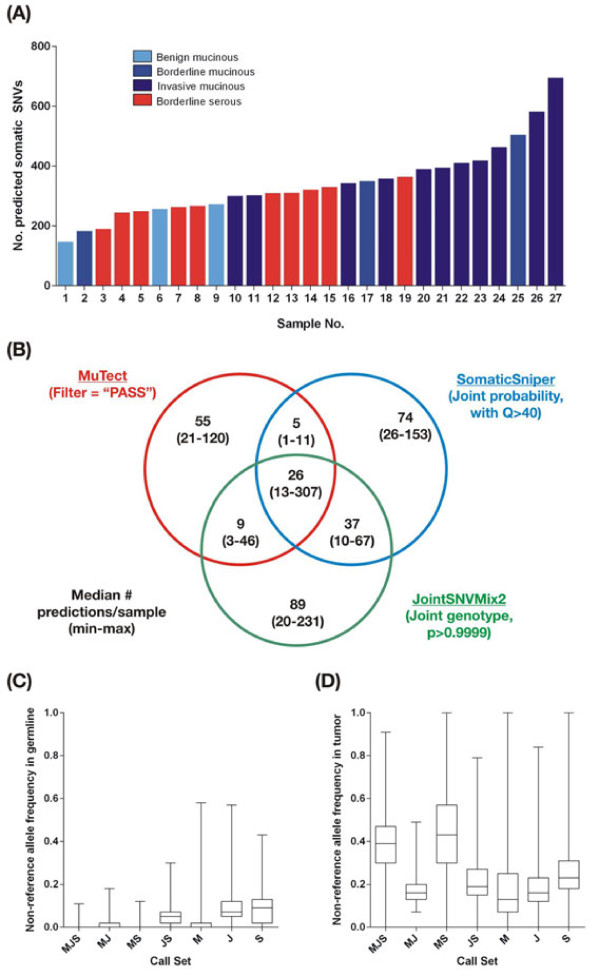
Figure 1.
Frequency, concordance and read depths of somatic variant predictions in 27 ovarian tumors. (A) The total number of somatic SNVs predicted in each sample by the three algorithms. Bars are colored by tumor grade and histological subtype. (B) Concordance between somatic variant predictions from different algorithms. The minimum, maximum, and median numbers of predictions per 'call set’ per sample are shown. The filtering criterion used for each program is indicated. (C) Non-reference allele frequency, measured as the fraction of reads in the germline samples carrying the non-reference allele, at sites predicted to be somatic variants, within each call set. Each box covers the interquartile range, with a horizontal line representing the median. Whiskers indicate the minimum and maximum values. (D) Fraction of reads carrying the non-reference allele in the tumor samples at sites predicted to be somatic variants, within each call set. Call sets were defined by the programs that made a prediction above threshold using the following programs: M. MuTect, J = JointSNVMix2, S. SomaticSniper.

