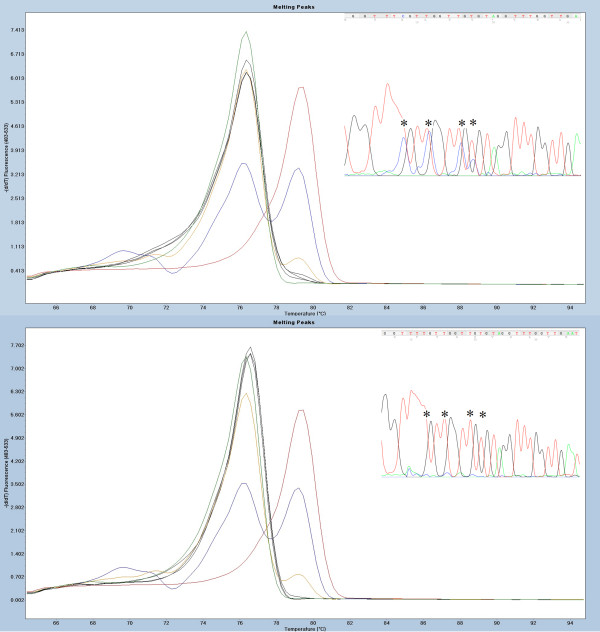
Figure 2.
Example of low-level methylation sample at HOXB13 differentially methylated region. Standards: 100% methylated (red), 10% methylated in a background of unmethylated template (blue), 1% methylated (yellow) and unmethylated standard (green). Sample with a representative high-resolution melting (HRM) profile (black). The top panel illustrates how even small aberrations of the HRM profile from the unmethylated standard represent low methylation levels. Methylation-sensitive HRM (MS-HRM) results are shown with the sample in black and confirmation of the HRM results with sequencing where asterisks indicate double-sequences at CpG sites (both alleles present: T (unmethylated allele) and C (methylated allele)). Lower panel displays the same data for an unmethylated sample. Melting peaks were generated by taking the negative derivative (d) of the melting curve data divided by the derivative with respect to time -(d/dT).

