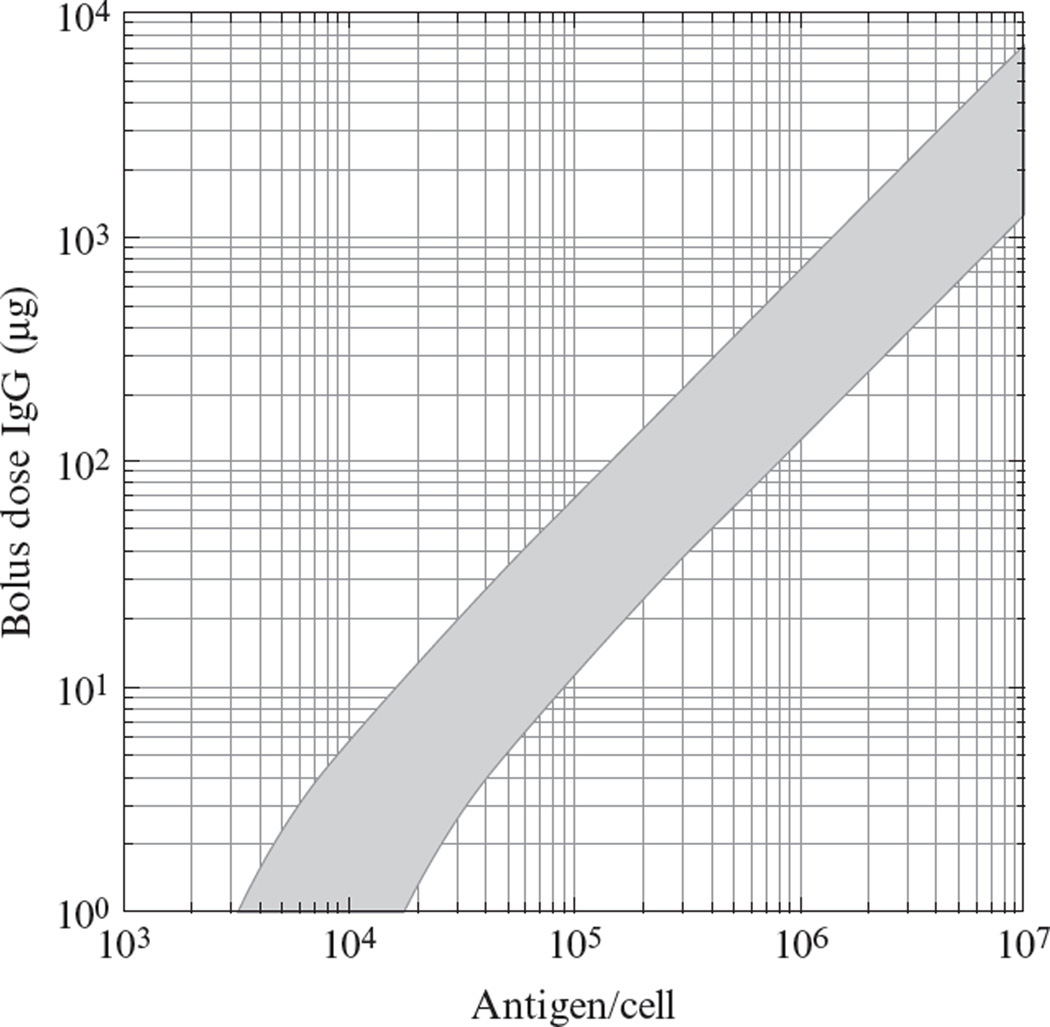
Figure 10.4.
Predicted bolus dose required to achieve tumor saturation in a mouse. The gray band represents the combination of doses and expression levels for which ϕ2 = 1, the threshold at which degradative consumption equals extravasation, when the degradation half-life for antibody/antigen complexes is in the range 10–54h, typical for constitutive turnover. The high-affinity limit for (Kd = 10pM) is represented. Other parameters are (Schmidt and Wittrup, 2009): ε = 0.24, D = 2.5 × 10⁻⁷cm2/s, P = 3.9 × 10⁻⁷ cm2/s, Rcap = 8µm, RKrogh = 60µm, mouse blood volume = 2ml, and tumor density = 3 × 10⁸ cells/ml (Schmidt et al., 2008).

