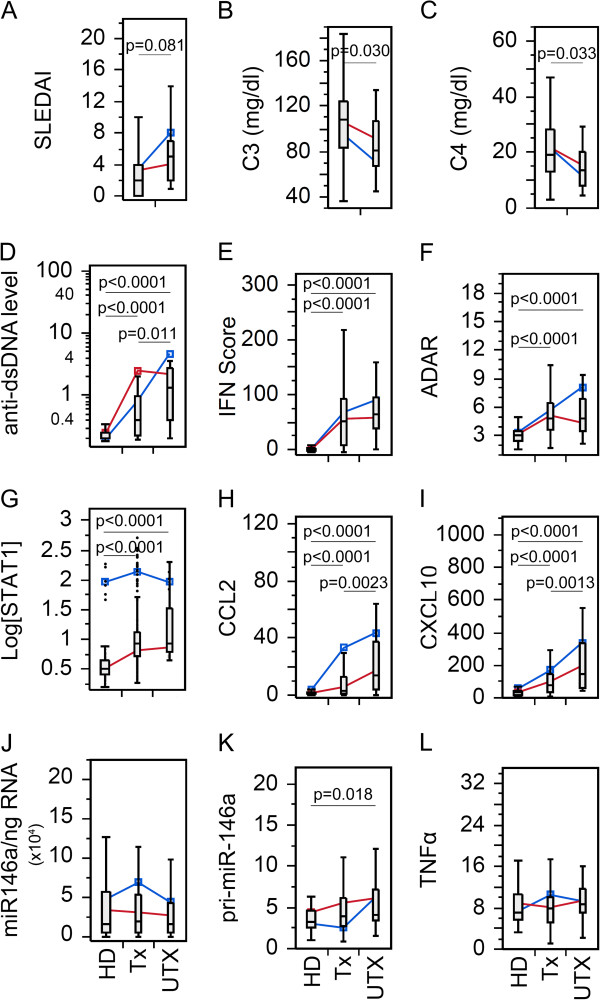
Figure 1.
Comparison in the levels of various clinical parameters and biomarkers in SLE patient visits with or without treatment. (A) Disease activity, (B-C) complement levels, (D) anti-dsDNA antibody levels, (E) IFN score, (F) ADAR, (G) STAT1, (H) CCL2, (I) CXCL10, (J) miR-146a, (K) pri-miR-146a, and (L). TNFα in treated (Tx) and untreated (UTX) SLE patient visits as well as healthy donors (HD). Data are presented as box plot. All groups were compared among each other and only significant P values are shown indicating each specific comparison. Average trend lines for high STAT1 (blue) and low STAT1 (red) patient visit subsets are also shown for comparison. Detail comparison between high and low STAT1 subsets are shown in Additional file 1: Figure S2. ADAR, adenosine deaminase acting on RNA; CCL2, C-C motif chemokine ligand 2; CXCL10, C-X-C motif chemokine 10; dsDNA, double-stranded DNA; IFN, interferon; SLE, systemic lupus erythematosus; STAT1, signal transducer and activator of transcription 1; TNFα, tumor necrosis factor alpha.

