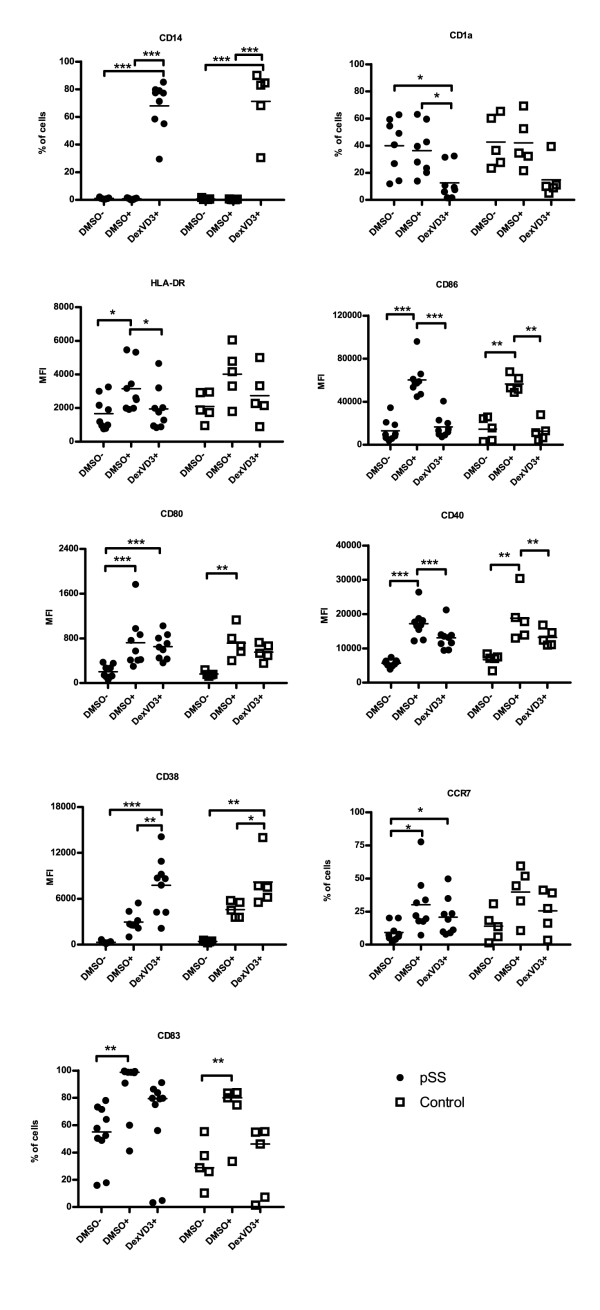
Figure 1.
Monocyte-derived tolDC from patients with pSS have a similar phenotype to tolDC from healthy controls. The percentage of positive cells or median fluorescence intensity (MFI) is shown. MFI was used when all DC populations showed more than 90 percent positivity. Each symbol represents an independent sample, n = 9 for DC from patients with pSS (filled circles) and n = 5 for DC from healthy controls (open squares). Differences between the expression of surface markers are marked with the following: *P ≤ 0.05; **P ≤ 0.01; ***P ≤ 0.001. The bars indicate median. DMSO-, immature DC; DMSO+, LPS-stimulated DC; DexVD3+, LPS-stimulated DC generated in the presence of dexamethasone and 1alpha,25-dihydroxyvitamin D3; pSS, primary Sjögren's syndrome; tolDC, tolerogenic dendritic cells.

