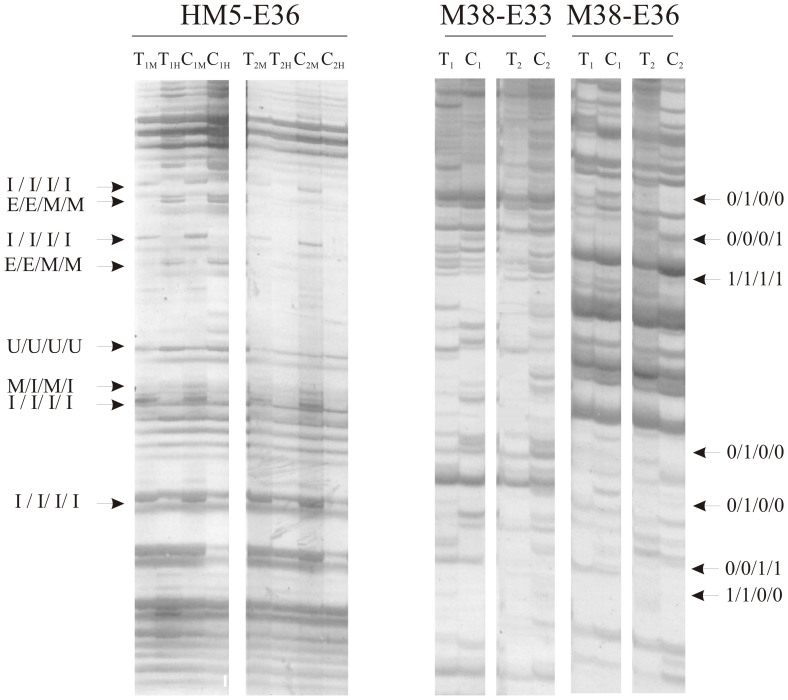
Figure 4. Examples of MSAP and AFLP profiles.
Left panel: MSAP amplicon produced with the HM5-E36 primer combination. 1 indicates samples obtained in 2003. 2 indicates samples obtained in 2007. M indicates digestion with MspI. H indicates digestion with HpaII (e.g., sample T1M corresponds to genotype Tanganyika, year 2003, MspI digestion). Different cytosine methylation patterns are indicated by arrows on the left. Right panels: AFLP amplicons produced with the M38-E33 and M38-E36 primer combinations. 1 indicates samples obtained in 2003. 2 indicates samples obtained in 2007 (e.g., sample T1 corresponds to genotype Tanganyika, year 2003). Different genetic patterns produced by primer combination M38-E36 are indicated by arrows on the left. Full length blots are presented in the Supplementary Information.

