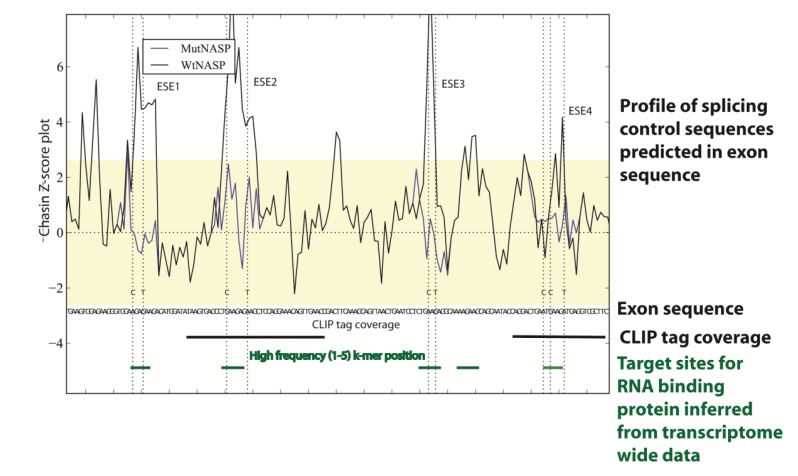
Figure 3.
Transcriptome-wide data can be used to predict the splicing code in specific genes. In this example sequences within a cassette exon in the mouse NASP gene have been analysed using genome and transcriptome wide datasets to pinpoint splicing control sequences. Firstly a Chasin Z-score plot was used that can identify sequences predictive of exonic splicing enhancers and silencers [32,34]: the four exonic splicing enhancer (ESE) sequences identified are shown as peaks in the plot above the sequence. In this example, these ESE sequences were individually mutated to test function in minigenes (the Chasin profiles of the mutants M1-M4 are shown compared to the wild type sequence: notice the change in the Z-score plot removes predicted ESE activity for each mutant). The positions of these ESEs mapped to binding sites for the splicing factor Tra2β, both individually identified using cross linking immunoprecipitation (CLIP) in the mouse testis and predicted from the in vivo binding site generated from transcriptome-wide Tra2β binding data from the mouse testis. This figure is adapted from [32].

