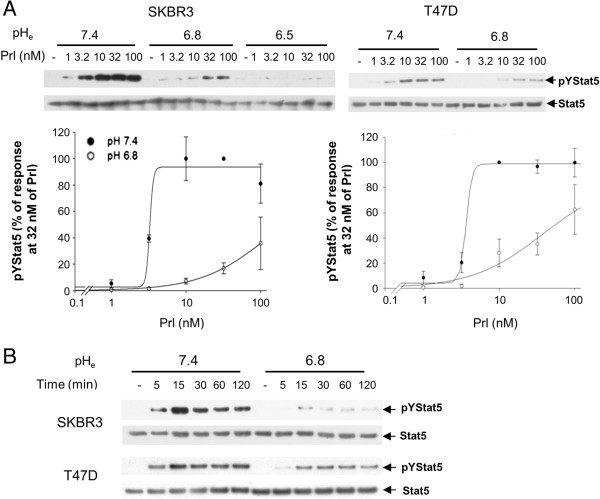
Figure 3.
Dose-dependent response and time course of prolactin-induced Stat5 tyrosine phosphorylation at different levels of pHe. (A) Different concentrations of prolactin (1 to 100 nM) were used to induce SKBR3 or T47D cells at normal tissue pHe (pHe 7.4) or acidic tumor pHe (pHe 6.8 or pHe 6.5). Representative data on levels of pYStat5 and total Stat5 protein is presented with densitometric analyses shown representing independent experiments in SKBR3 (n = 4) and T47D (n = 3). (B) SKBR3 and T47D cells were treated with prolactin for indicated length of time and representative pYStat5 and Stat5 levels are shown (n = 4). pHe, extracellular pH.

