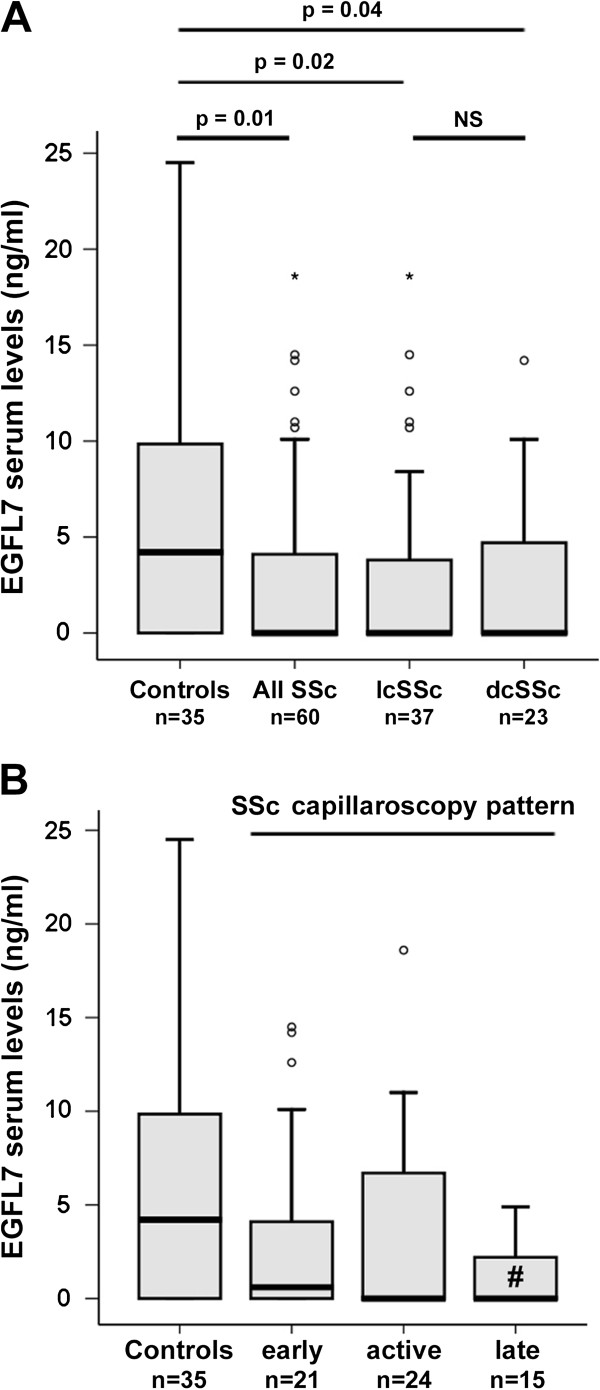
Figure 1.

Serum levels of epidermal growth factor-like domain 7 (EGFL7) determined by colorimetric sandwich ELISA. (A) Serum EGFL7 levels in healthy controls, all patients with systemic sclerosis (SSc), patients with limited cutaneous SSc (lcSSc) and patients with diffuse cutaneous SSc (dcSSc). (B) Serum levels of EGFL7 in patients with SSc according to nailfold videocapillaroscopy pattern (early, active and late). Data are shown as box plots. Each box represents the 25th to 75th percentiles. Lines inside the boxes represent the median. Lines outside the boxes represent the 10th and the 90th percentiles. Circles indicate outliers, and asterisks indicate the extreme values. #P = 0.006 versus controls. Mann–Whitney U-test was used for statistical analysis. NS, not significant.
