
Figure 4.
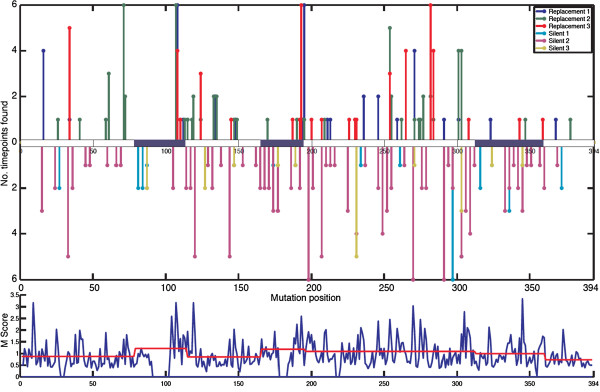
Time points that include specific mutations relative to the imputed germline sequence. (Top) number of time points with specific R mutations (line going up) and S mutations (line going down) at a specific position in the V region sequence. Some positions allow multiple different nucleotide substitutions. For this reason, each R or S mutation can be a combination of up to three lines, each of which represents a different nucleotide substitution at that position. The complementarity-determining regions (CDRs) are marked in blue shaded boxes. (Bottom) mutability score (see Methods) by position. A mutability score above 1 indicates a relatively increased tendency to mutate. The average mutability per region—CDR or framework region (FWR)—is indicated by the red line.