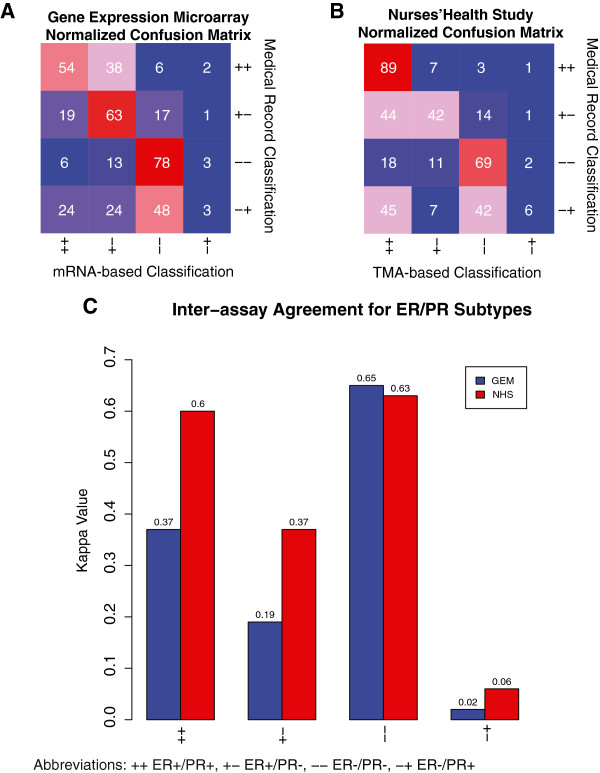
Figure 4.
Inter-assay agreement confusion matrices for ER/PR subtypes. A and B present 4 × 4 confusion matrices. A: Gene Expression Microarray (GEM) Dataset. The row and columns indicate the ER/PR classifications made in the medical record from the GEM dataset (rows) and by mRNA (columns). The value in each cell in the matrix indicates the proportion of the row’s subtype that was classified in the column’s subtype. The color represents the proportion agreement from blue (low) to red (high). B: Nurses’ Health Study (NHS) Dataset. This confusion matrix is similar to that described in A, but the rows represent the ER/PR classifications from the medical record in the NHS dataset and the columns represent the classifications made from the NHS TMA analysis. C: Kappa Values for the gene expression microarray (GEM) and Nurses’ Health Study (NHS) datasets.

