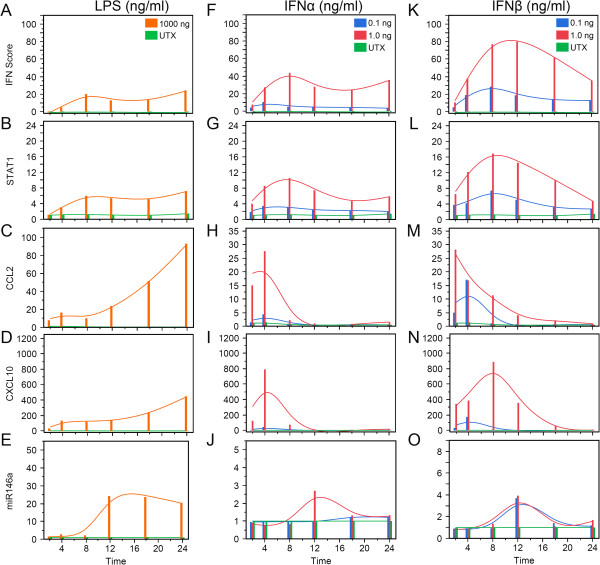
Figure 8.
THP-1 response to IFNα, IFNβ, and LPS over a period of 24 h. THP-1 cells were treated with different doses of IFNα, IFNβ, and LPS and lysates were harvested at various times from 2 to 24 h for RNA isolation and analyses. IFN score (A, F, K), and the expression of STAT1 (B, G, L), CCL2 (C, H, M), CXCL10 (D, I, N), and miR-146a (E, J, O) were evaluated at 0.1 and 1.0 ng/ml of IFNα2 and IFNβ as well as 1,000 ng/ml of LPS. LPS, lipopolysaccharide; STAT, signal transducers and activators of transcription; CCL2, C-C motif chemokine ligand 2; CXCL10, C-X-C motif chemokine 10; UTX, untreated.

