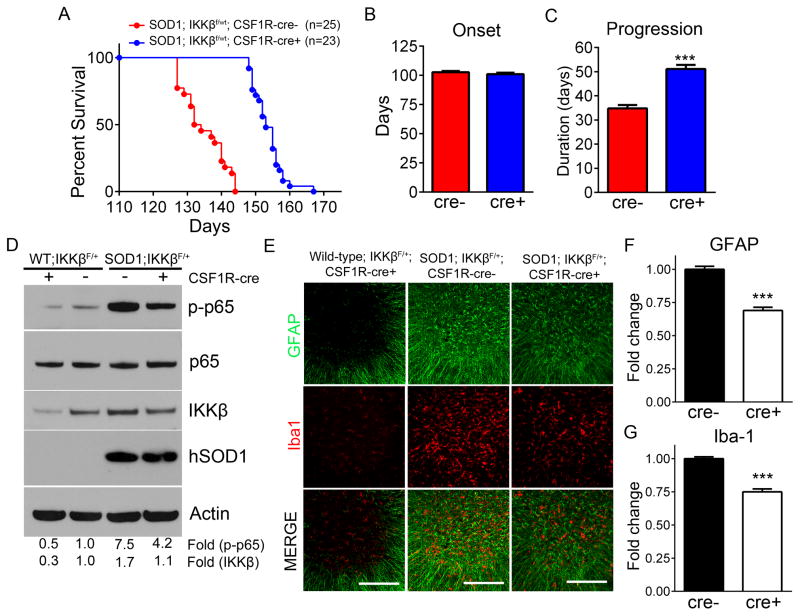
Figure 5. SOD1-G93A microglia induce MN death in an NF-κB dependent mechanism in vivo.
(A) Kaplan-Meier survival curve of SOD1-G93A; IKKβF/wt; CSF1R-cre- (n=22) and SOD1-G93A; IKKβF/wt; CSF-1R-cre+ mice (n=25). Median survival SOD1-G93A; IKKβF/wt; CSF1R-cre- = 133 days, SOD1-G93A; IKKβF/wt; CSF-1R-cre+=153 days. Mean survival SOD1-G93A; IKKβF/wt; CSF1R-cre- =134.9±1.4 days, SOD1-G93A; IKKβF/wt; CSF-1R-cre+=153.7±0.9 days, P<.0001
(B) Disease onset determined by age at which peak weight was reached. SOD1-G93A; IKKβF/wt; CSF1R-cre-reached onset at 102.8±1.1 days and SOD1-G93A; IKKβF/wt; CSF1R-cre+ mice reached onset at 101.1±1.3 days.
(C) Disease progression defined as time from disease onset to ES. SOD1-G93A; IKKβF/wt; CSF1R-cre- mean disease progression = 34.8±1.4 days and SOD1-G93A; IKKβF/wt; CSF1R-cre+ mean disease progression = 51.1±1.7 days.
(D) Immunoblot of lumbar spinal cord protein isolated from WT; IKKβF/wt; CSF1R-cre+, WT; IKKβF/wt; CSF1R-cre-, and ES SOD1-G93A; IKKβF/wt; CSF1R-cre-, SOD1-G93A; IKKβF/wt CSF1R-cre+ mice probed for phospho-p65 (top), total p65, IKKβ, human SOD1 and Actin (bottom). Fold change represents band intensities of phospho-p65 normalized to p65/Actin and IKKβ normalized to Actin.
(E) Immunohistochemistry of Iba1-positive microglia (red) and GFAP-positive astrocytes (green) in the lumbar spinal cords of ES SOD1-G93A; IKKβF/wt CSF1R-cre-, and age-matched SOD1-G93A; IKKβf/wt CSF1R-cre+, and WT IKKβf/wt CSF1R-cre+ littermates. Scale bar = 200 microns
(F and G) Quantification of GFAP and Iba-1 signal intensity in SOD1-G93A; IKKβF/wt CSF1R-cre- and age-matched SOD1-G93A; IKKβf/wt CSF1R-cre+ immunohistochemistry in represented in (E).
Error bars represent s.e.m. ***, P< 0.001. See also Figure S4 and Movie S5.

