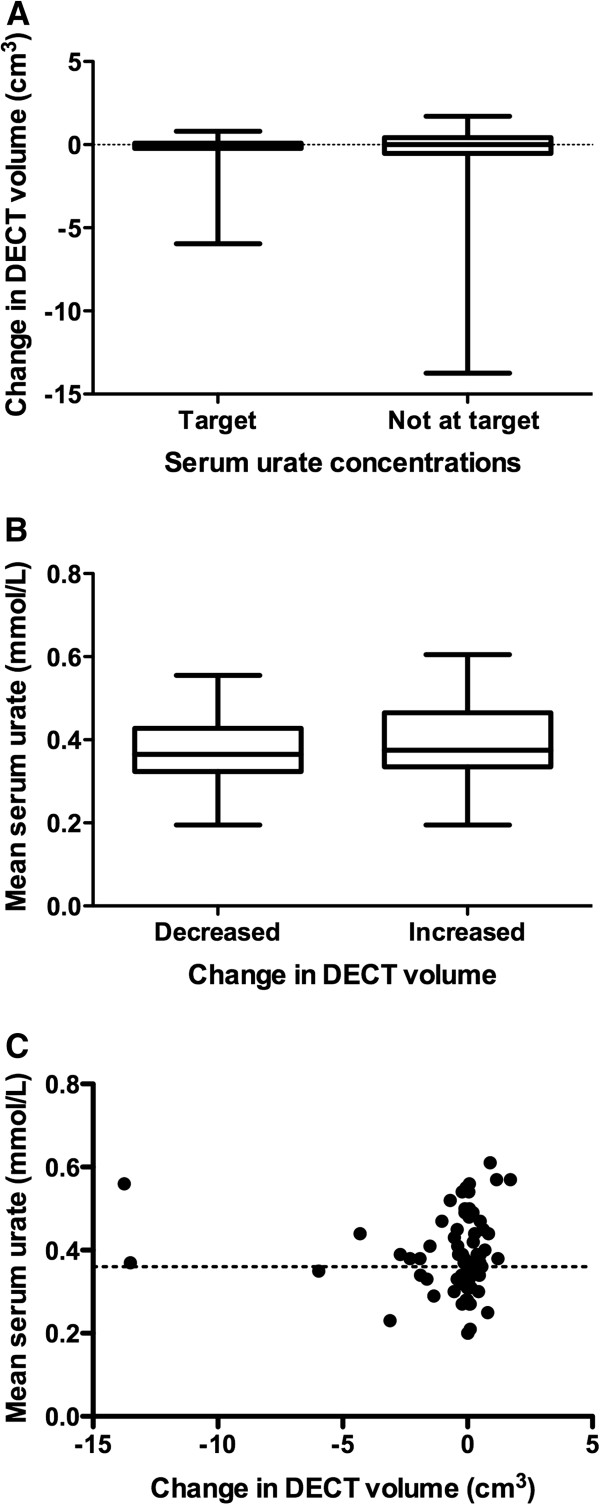
Figure 2.
Relationship between changes in dual-energy computed tomography urate volumes and serum urate concentrations. (A) Box-and-whisker plot showing dual-energy computed tomography (DECT) urate volume in patients with serum urate concentrations at the therapeutic target (less than 0.36 mmol/L) at both time points and those not at target at both time points. (B) Box-and-whisker plot showing mean serum urate concentrations (baseline and year 1) in patients with decreased and increased DECT urate volumes over the one-year observation period. (C) Scatterplot showing the relationship between change in DECT urate volume from baseline to year 1 and mean serum urate concentrations (baseline and year 1).

